Zip Codes with the Highest Percentage of Population Employed in Legal Services & Support in Clarksville, TN
RELATED REPORTS & OPTIONS
Legal Services & Support
Clarksville
Compare Zip Codes
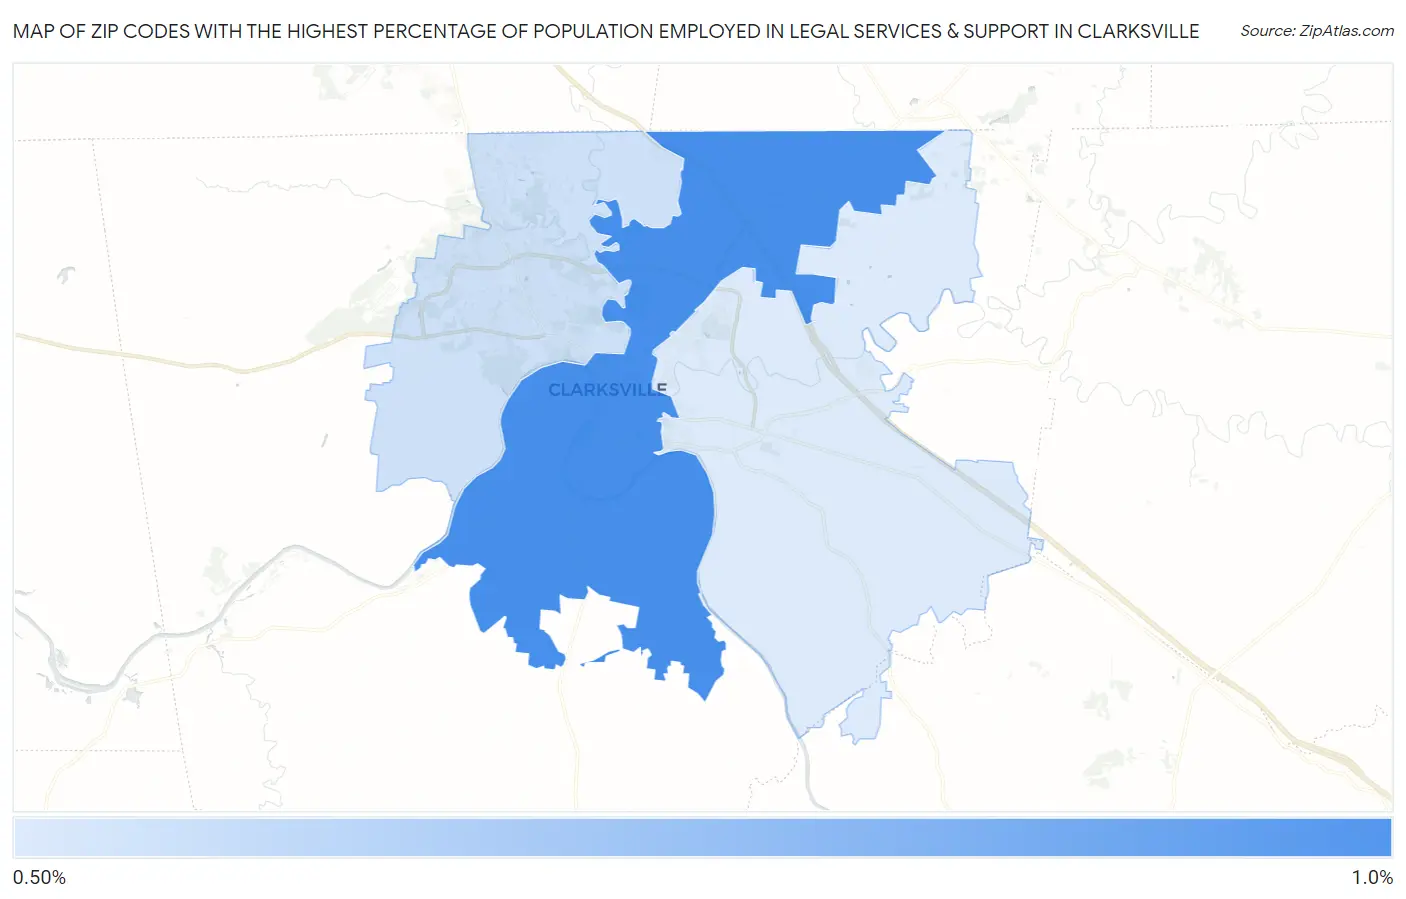
Map of Zip Codes with the Highest Percentage of Population Employed in Legal Services & Support in Clarksville
0.56%
0.82%
Zip Codes with the Highest Percentage of Population Employed in Legal Services & Support in Clarksville, TN
| Zip Code | % Employed | vs State | vs National | |
| 1. | 37040 | 0.82% | 0.90%(-0.074)#150 | 1.2%(-0.360)#9,241 |
| 2. | 37042 | 0.58% | 0.90%(-0.318)#198 | 1.2%(-0.604)#11,693 |
| 3. | 37043 | 0.56% | 0.90%(-0.343)#206 | 1.2%(-0.629)#12,000 |
1
Common Questions
What are the Top Zip Codes with the Highest Percentage of Population Employed in Legal Services & Support in Clarksville, TN?
Top Zip Codes with the Highest Percentage of Population Employed in Legal Services & Support in Clarksville, TN are:
What zip code has the Highest Percentage of Population Employed in Legal Services & Support in Clarksville, TN?
37040 has the Highest Percentage of Population Employed in Legal Services & Support in Clarksville, TN with 0.82%.
What is the Percentage of Population Employed in Legal Services & Support in Clarksville, TN?
Percentage of Population Employed in Legal Services & Support in Clarksville is 0.69%.
What is the Percentage of Population Employed in Legal Services & Support in Tennessee?
Percentage of Population Employed in Legal Services & Support in Tennessee is 0.90%.
What is the Percentage of Population Employed in Legal Services & Support in the United States?
Percentage of Population Employed in Legal Services & Support in the United States is 1.2%.