Zip Codes with the Highest Percentage of Population Employed in Architecture & Engineering in Scranton, PA
RELATED REPORTS & OPTIONS
Architecture & Engineering
Scranton
Compare Zip Codes
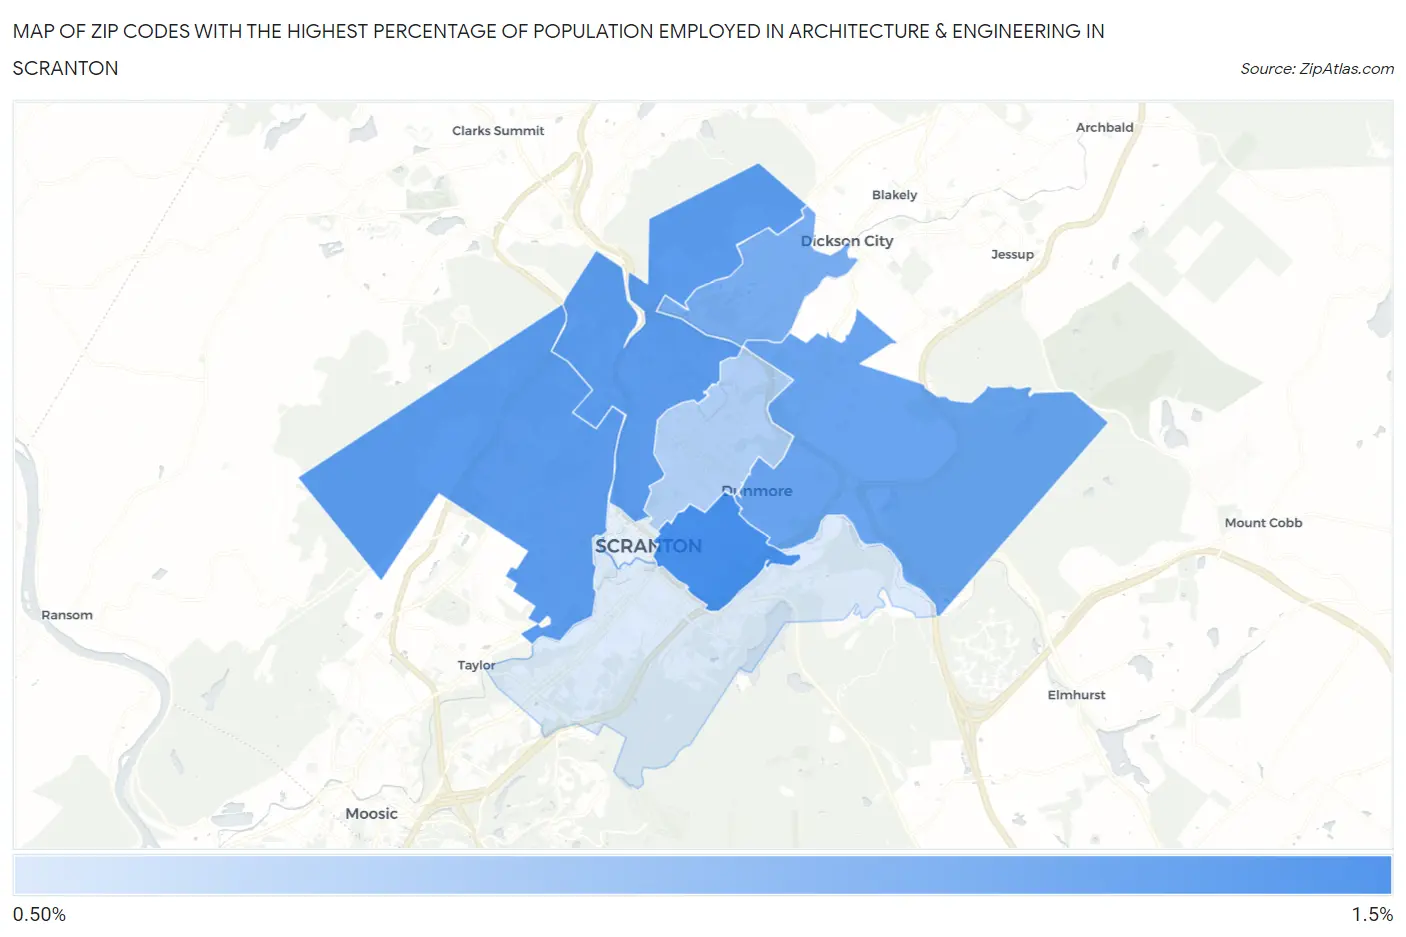
Map of Zip Codes with the Highest Percentage of Population Employed in Architecture & Engineering in Scranton
0.58%
1.4%
Zip Codes with the Highest Percentage of Population Employed in Architecture & Engineering in Scranton, PA
| Zip Code | % Employed | vs State | vs National | |
| 1. | 18510 | 1.4% | 2.0%(-0.653)#803 | 2.1%(-0.761)#13,675 |
| 2. | 18504 | 1.3% | 2.0%(-0.756)#848 | 2.1%(-0.864)#14,410 |
| 3. | 18508 | 1.3% | 2.0%(-0.763)#852 | 2.1%(-0.871)#14,461 |
| 4. | 18512 | 1.2% | 2.0%(-0.842)#888 | 2.1%(-0.950)#15,087 |
| 5. | 18519 | 1.1% | 2.0%(-0.919)#922 | 2.1%(-1.03)#15,672 |
| 6. | 18509 | 0.81% | 2.0%(-1.23)#1,034 | 2.1%(-1.33)#18,015 |
| 7. | 18505 | 0.58% | 2.0%(-1.46)#1,122 | 2.1%(-1.57)#19,770 |
1
Common Questions
What are the Top 5 Zip Codes with the Highest Percentage of Population Employed in Architecture & Engineering in Scranton, PA?
Top 5 Zip Codes with the Highest Percentage of Population Employed in Architecture & Engineering in Scranton, PA are:
What zip code has the Highest Percentage of Population Employed in Architecture & Engineering in Scranton, PA?
18510 has the Highest Percentage of Population Employed in Architecture & Engineering in Scranton, PA with 1.4%.
What is the Percentage of Population Employed in Architecture & Engineering in Scranton, PA?
Percentage of Population Employed in Architecture & Engineering in Scranton is 0.81%.
What is the Percentage of Population Employed in Architecture & Engineering in Pennsylvania?
Percentage of Population Employed in Architecture & Engineering in Pennsylvania is 2.0%.
What is the Percentage of Population Employed in Architecture & Engineering in the United States?
Percentage of Population Employed in Architecture & Engineering in the United States is 2.1%.