Zip Codes with the Highest Percentage of Immigrants from Northern Europe in Scranton, PA
RELATED REPORTS & OPTIONS
Northern Europe
Scranton
Compare Zip Codes
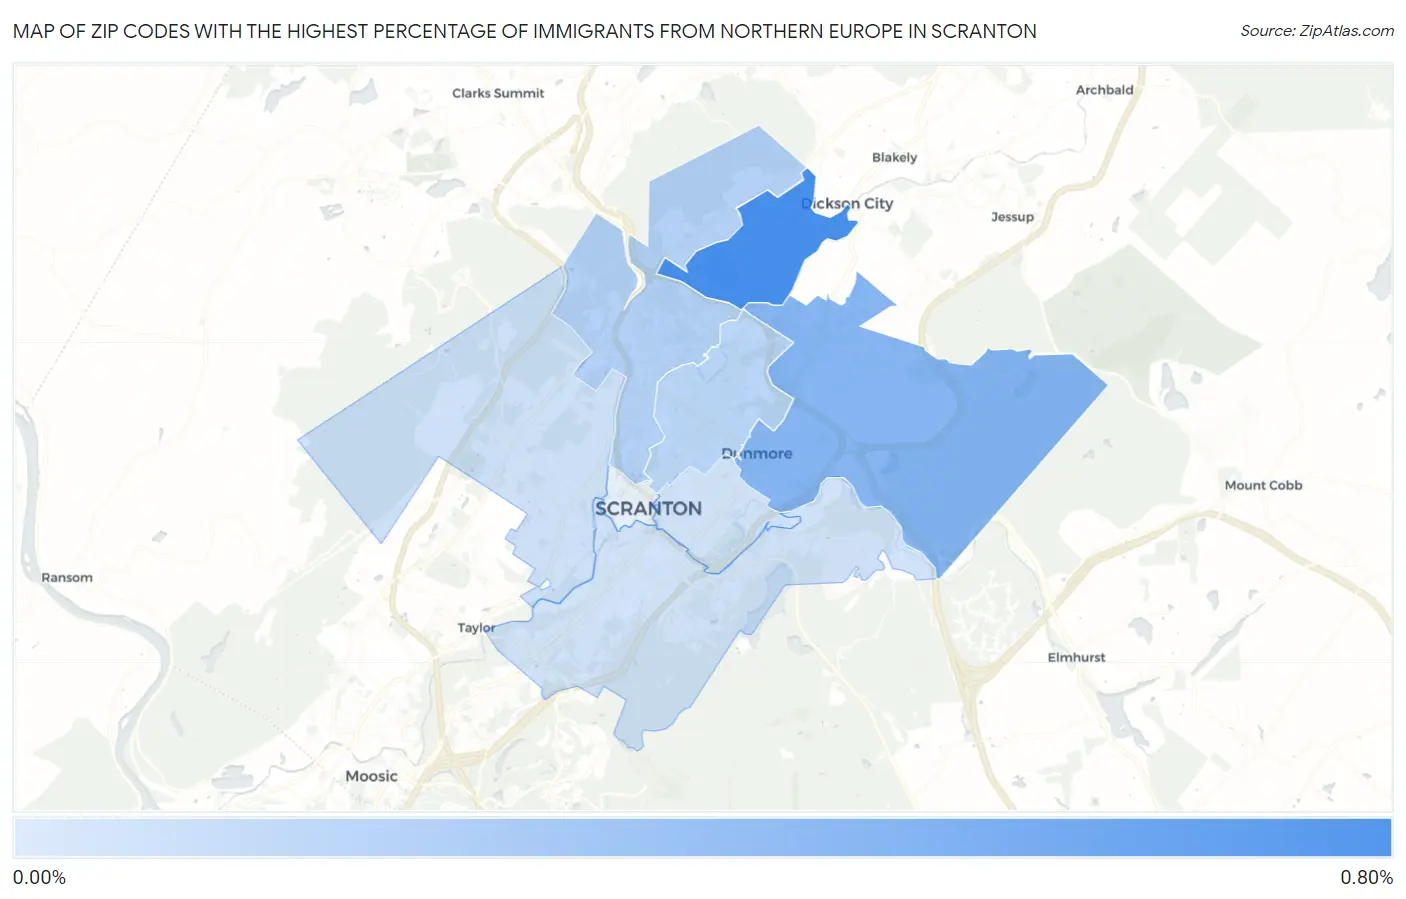
Map of Zip Codes with the Highest Percentage of Immigrants from Northern Europe in Scranton
0.046%
0.64%
Zip Codes with the Highest Percentage of Immigrants from Northern Europe in Scranton, PA
| Zip Code | Northern Europe | vs State | vs National | |
| 1. | 18519 | 0.64% | 0.22%(+0.428)#106 | 0.29%(+0.360)#2,748 |
| 2. | 18512 | 0.37% | 0.22%(+0.156)#205 | 0.29%(+0.087)#4,915 |
| 3. | 18508 | 0.18% | 0.22%(-0.040)#365 | 0.29%(-0.108)#8,310 |
| 4. | 18509 | 0.15% | 0.22%(-0.064)#400 | 0.29%(-0.132)#8,897 |
| 5. | 18504 | 0.058% | 0.22%(-0.159)#588 | 0.29%(-0.227)#11,764 |
| 6. | 18510 | 0.048% | 0.22%(-0.169)#606 | 0.29%(-0.237)#12,098 |
| 7. | 18505 | 0.046% | 0.22%(-0.171)#609 | 0.29%(-0.239)#12,157 |
1
Common Questions
What are the Top 5 Zip Codes with the Highest Percentage of Immigrants from Northern Europe in Scranton, PA?
Top 5 Zip Codes with the Highest Percentage of Immigrants from Northern Europe in Scranton, PA are:
What zip code has the Highest Percentage of Immigrants from Northern Europe in Scranton, PA?
18519 has the Highest Percentage of Immigrants from Northern Europe in Scranton, PA with 0.64%.
What is the Percentage of Immigrants from Northern Europe in Scranton, PA?
Percentage of Immigrants from Northern Europe in Scranton is 0.079%.
What is the Percentage of Immigrants from Northern Europe in Pennsylvania?
Percentage of Immigrants from Northern Europe in Pennsylvania is 0.22%.
What is the Percentage of Immigrants from Northern Europe in the United States?
Percentage of Immigrants from Northern Europe in the United States is 0.29%.