Zip Codes with the Highest Percentage of Population Employed in Real Estate, Rental & Leasing in Scranton, PA
RELATED REPORTS & OPTIONS
Real Estate, Rental & Leasing
Scranton
Compare Zip Codes
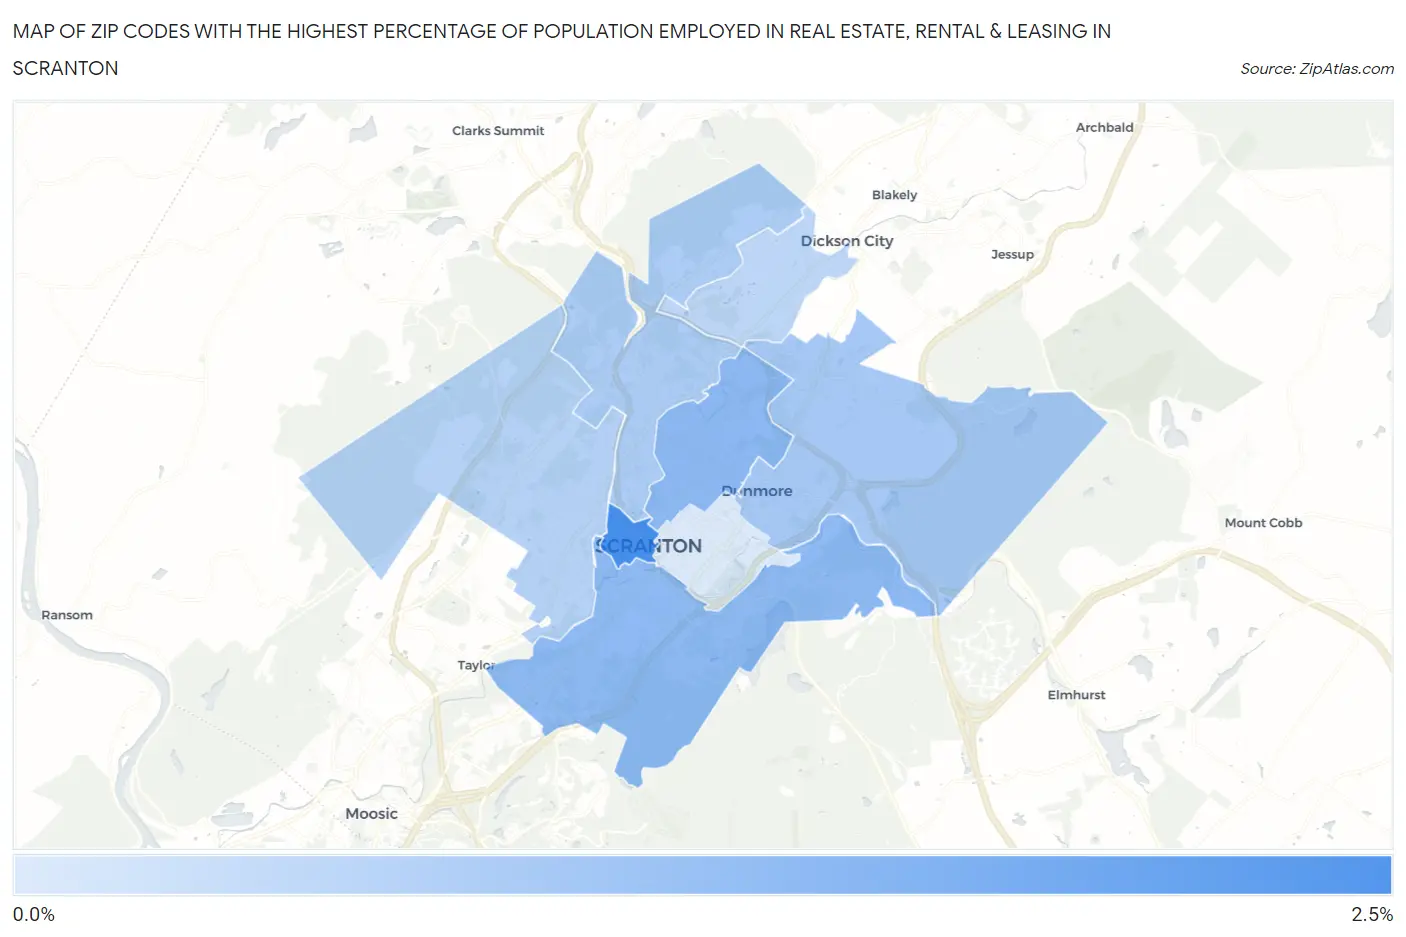
Map of Zip Codes with the Highest Percentage of Population Employed in Real Estate, Rental & Leasing in Scranton
0.45%
2.2%
Zip Codes with the Highest Percentage of Population Employed in Real Estate, Rental & Leasing in Scranton, PA
| Zip Code | % Employed | vs State | vs National | |
| 1. | 18503 | 2.2% | 1.5%(+0.715)#235 | 1.9%(+0.316)#6,774 |
| 2. | 18509 | 1.4% | 1.5%(-0.106)#510 | 1.9%(-0.505)#12,085 |
| 3. | 18505 | 1.4% | 1.5%(-0.127)#517 | 1.9%(-0.526)#12,240 |
| 4. | 18512 | 1.1% | 1.5%(-0.407)#653 | 1.9%(-0.806)#14,411 |
| 5. | 18508 | 1.0% | 1.5%(-0.470)#681 | 1.9%(-0.869)#14,964 |
| 6. | 18504 | 0.91% | 1.5%(-0.580)#740 | 1.9%(-0.978)#15,862 |
| 7. | 18519 | 0.82% | 1.5%(-0.673)#788 | 1.9%(-1.07)#16,572 |
| 8. | 18510 | 0.45% | 1.5%(-1.04)#983 | 1.9%(-1.44)#19,439 |
1
Common Questions
What are the Top 5 Zip Codes with the Highest Percentage of Population Employed in Real Estate, Rental & Leasing in Scranton, PA?
Top 5 Zip Codes with the Highest Percentage of Population Employed in Real Estate, Rental & Leasing in Scranton, PA are:
What zip code has the Highest Percentage of Population Employed in Real Estate, Rental & Leasing in Scranton, PA?
18503 has the Highest Percentage of Population Employed in Real Estate, Rental & Leasing in Scranton, PA with 2.2%.
What is the Percentage of Population Employed in Real Estate, Rental & Leasing in Scranton, PA?
Percentage of Population Employed in Real Estate, Rental & Leasing in Scranton is 1.1%.
What is the Percentage of Population Employed in Real Estate, Rental & Leasing in Pennsylvania?
Percentage of Population Employed in Real Estate, Rental & Leasing in Pennsylvania is 1.5%.
What is the Percentage of Population Employed in Real Estate, Rental & Leasing in the United States?
Percentage of Population Employed in Real Estate, Rental & Leasing in the United States is 1.9%.