Zip Codes with the Highest Percentage of Population Employed in Transportation in Scranton, PA
RELATED REPORTS & OPTIONS
Transportation
Scranton
Compare Zip Codes
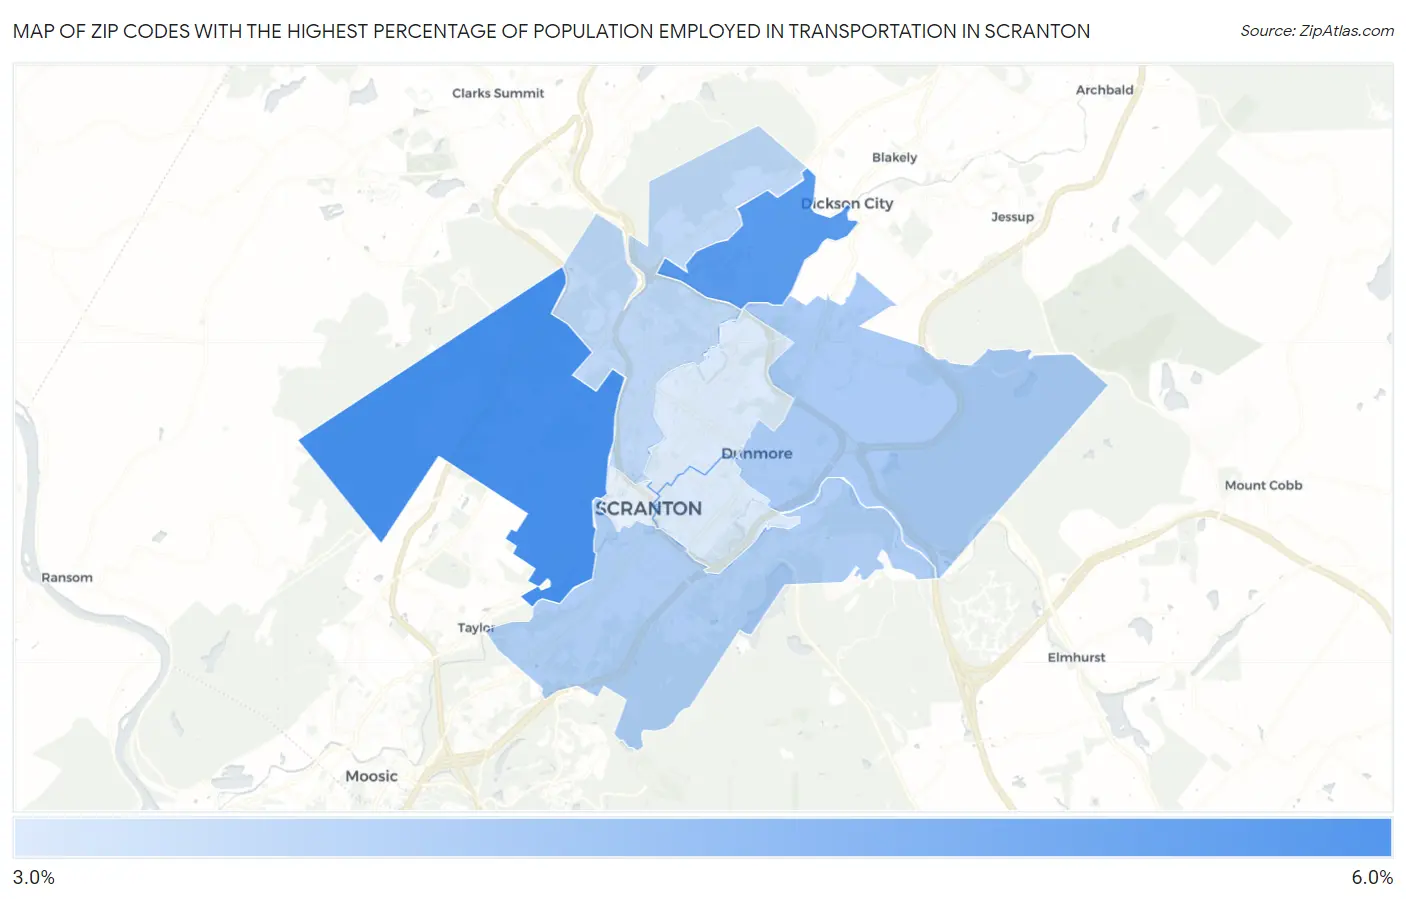
Map of Zip Codes with the Highest Percentage of Population Employed in Transportation in Scranton
3.1%
5.6%
Zip Codes with the Highest Percentage of Population Employed in Transportation in Scranton, PA
| Zip Code | % Employed | vs State | vs National | |
| 1. | 18504 | 5.6% | 3.8%(+1.75)#521 | 3.8%(+1.76)#8,517 |
| 2. | 18519 | 5.3% | 3.8%(+1.49)#588 | 3.8%(+1.49)#9,343 |
| 3. | 18512 | 3.9% | 3.8%(+0.084)#901 | 3.8%(+0.087)#14,813 |
| 4. | 18505 | 3.8% | 3.8%(+0.011)#920 | 3.8%(+0.014)#15,138 |
| 5. | 18508 | 3.6% | 3.8%(-0.261)#995 | 3.8%(-0.258)#16,531 |
| 6. | 18510 | 3.1% | 3.8%(-0.737)#1,112 | 3.8%(-0.734)#18,836 |
| 7. | 18509 | 3.1% | 3.8%(-0.752)#1,116 | 3.8%(-0.748)#18,911 |
1
Common Questions
What are the Top 5 Zip Codes with the Highest Percentage of Population Employed in Transportation in Scranton, PA?
Top 5 Zip Codes with the Highest Percentage of Population Employed in Transportation in Scranton, PA are:
What zip code has the Highest Percentage of Population Employed in Transportation in Scranton, PA?
18504 has the Highest Percentage of Population Employed in Transportation in Scranton, PA with 5.6%.
What is the Percentage of Population Employed in Transportation in Scranton, PA?
Percentage of Population Employed in Transportation in Scranton is 3.8%.
What is the Percentage of Population Employed in Transportation in Pennsylvania?
Percentage of Population Employed in Transportation in Pennsylvania is 3.8%.
What is the Percentage of Population Employed in Transportation in the United States?
Percentage of Population Employed in Transportation in the United States is 3.8%.