Zip Codes with the Highest Percentage of Population Employed in Business & Financial in Scranton, PA
RELATED REPORTS & OPTIONS
Business & Financial
Scranton
Compare Zip Codes
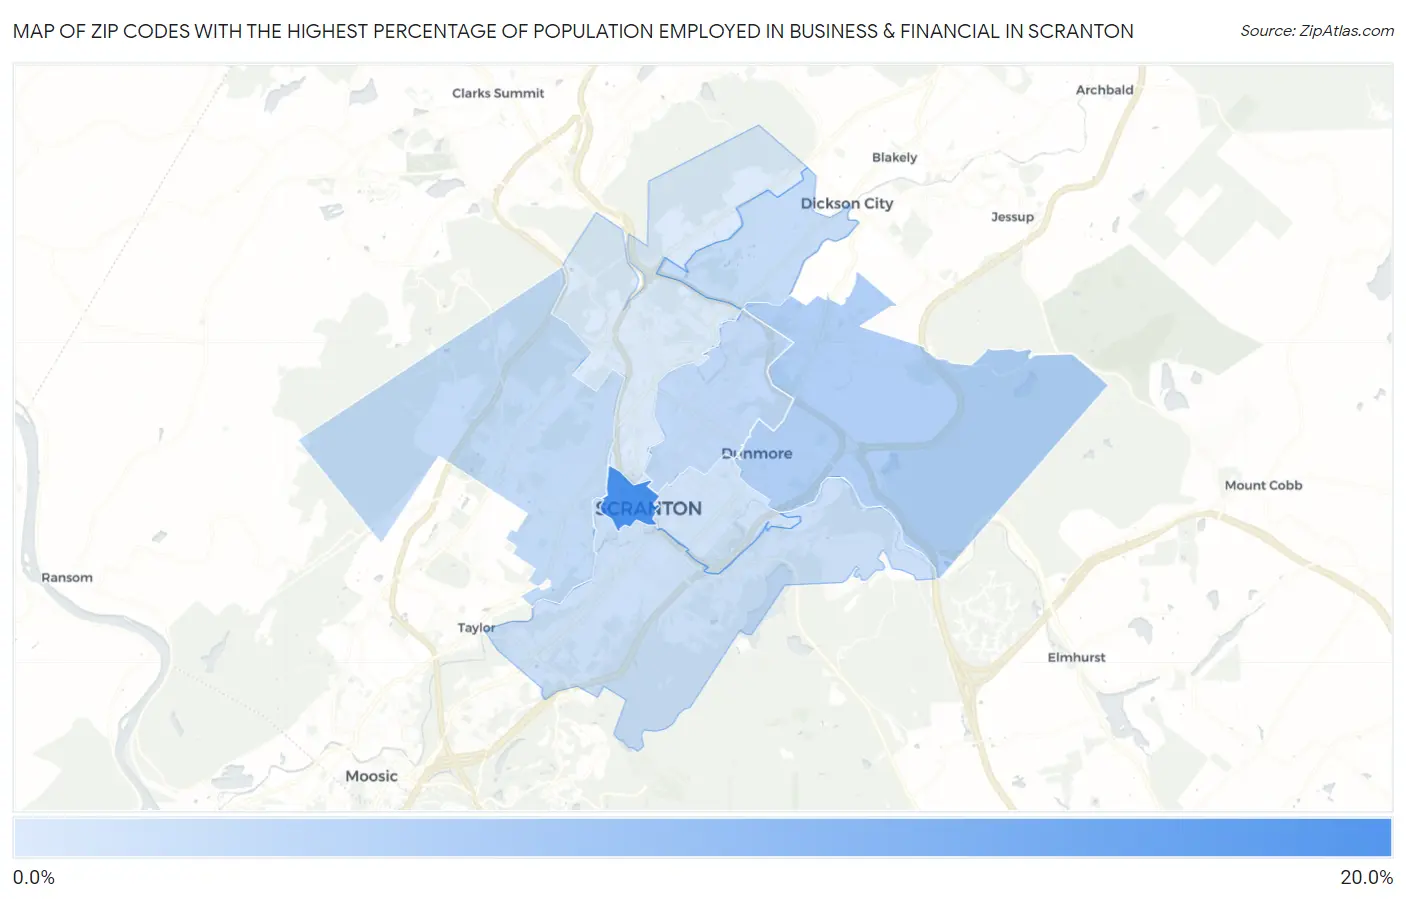
Map of Zip Codes with the Highest Percentage of Population Employed in Business & Financial in Scranton
0.98%
17.7%
Zip Codes with the Highest Percentage of Population Employed in Business & Financial in Scranton, PA
| Zip Code | % Employed | vs State | vs National | |
| 1. | 18503 | 17.7% | 5.9%(+11.8)#23 | 5.8%(+11.9)#376 |
| 2. | 18512 | 5.5% | 5.9%(-0.386)#500 | 5.8%(-0.255)#9,020 |
| 3. | 18509 | 3.9% | 5.9%(-2.03)#799 | 5.8%(-1.90)#14,329 |
| 4. | 18504 | 3.5% | 5.9%(-2.37)#881 | 5.8%(-2.24)#15,722 |
| 5. | 18519 | 3.4% | 5.9%(-2.49)#912 | 5.8%(-2.35)#16,203 |
| 6. | 18505 | 2.8% | 5.9%(-3.14)#1,051 | 5.8%(-3.01)#18,845 |
| 7. | 18510 | 2.1% | 5.9%(-3.75)#1,184 | 5.8%(-3.62)#21,217 |
| 8. | 18508 | 0.98% | 5.9%(-4.91)#1,380 | 5.8%(-4.78)#25,070 |
1
Common Questions
What are the Top 5 Zip Codes with the Highest Percentage of Population Employed in Business & Financial in Scranton, PA?
Top 5 Zip Codes with the Highest Percentage of Population Employed in Business & Financial in Scranton, PA are:
What zip code has the Highest Percentage of Population Employed in Business & Financial in Scranton, PA?
18503 has the Highest Percentage of Population Employed in Business & Financial in Scranton, PA with 17.7%.
What is the Percentage of Population Employed in Business & Financial in Scranton, PA?
Percentage of Population Employed in Business & Financial in Scranton is 3.0%.
What is the Percentage of Population Employed in Business & Financial in Pennsylvania?
Percentage of Population Employed in Business & Financial in Pennsylvania is 5.9%.
What is the Percentage of Population Employed in Business & Financial in the United States?
Percentage of Population Employed in Business & Financial in the United States is 5.8%.