Zip Codes with the Highest Percentage of Population Employed in Life, Physical & Social Science in Columbus, OH
RELATED REPORTS & OPTIONS
Life, Physical & Social Science
Columbus
Compare Zip Codes
Map of Zip Codes with the Highest Percentage of Population Employed in Life, Physical & Social Science in Columbus
0.15%
5.7%
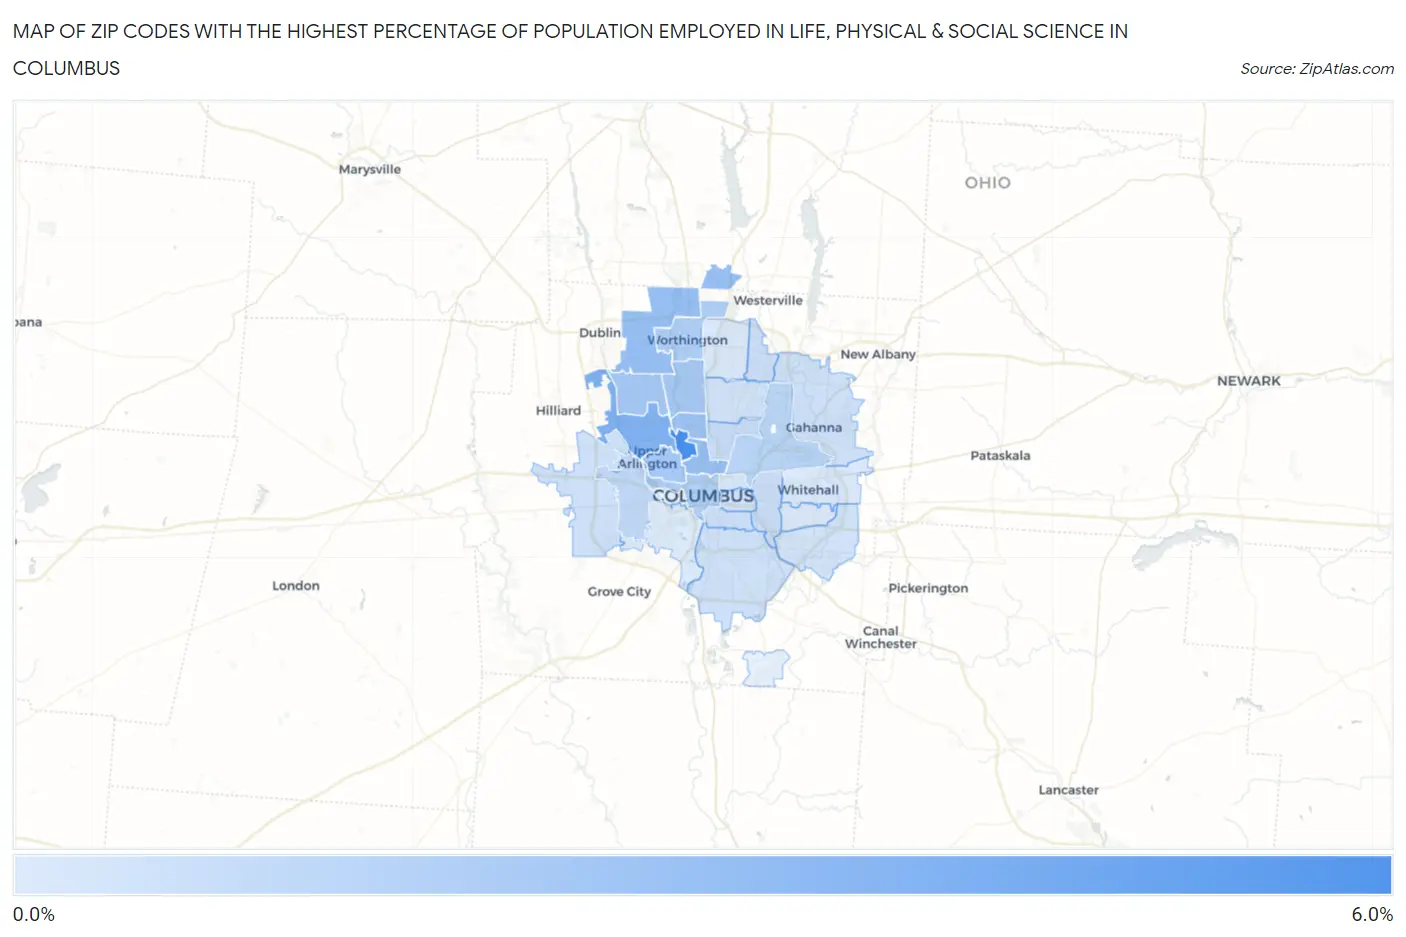
Zip Codes with the Highest Percentage of Population Employed in Life, Physical & Social Science in Columbus, OH
| Zip Code | % Employed | vs State | vs National | |
| 1. | 43210 | 5.7% | 0.90% (+4.76)#12 | 1.1% (+4.57)#598 |
| 2. | 43221 | 3.5% | 0.90% (+2.59)#30 | 1.1% (+2.40)#1,429 |
| 3. | 43240 | 2.7% | 0.90% (+1.77)#57 | 1.1% (+1.58)#2,288 |
| 4. | 43201 | 2.7% | 0.90% (+1.76)#58 | 1.1% (+1.57)#2,302 |
| 5. | 43235 | 2.6% | 0.90% (+1.72)#61 | 1.1% (+1.52)#2,368 |
| 6. | 43202 | 2.4% | 0.90% (+1.52)#72 | 1.1% (+1.33)#2,713 |
| 7. | 43214 | 2.2% | 0.90% (+1.29)#89 | 1.1% (+1.10)#3,207 |
| 8. | 43212 | 2.2% | 0.90% (+1.26)#92 | 1.1% (+1.06)#3,293 |
| 9. | 43220 | 2.1% | 0.90% (+1.22)#96 | 1.1% (+1.03)#3,372 |
| 10. | 43085 | 1.7% | 0.90% (+0.849)#123 | 1.1% (+0.655)#4,524 |
| 11. | 43215 | 1.7% | 0.90% (+0.841)#124 | 1.1% (+0.648)#4,561 |
| 12. | 43219 | 1.4% | 0.90% (+0.490)#168 | 1.1% (+0.297)#6,266 |
| 13. | 43204 | 1.1% | 0.90% (+0.252)#219 | 1.1% (+0.059)#7,857 |
| 14. | 43211 | 0.87% | 0.90% (-0.027)#307 | 1.1% (-0.221)#10,249 |
| 15. | 43231 | 0.80% | 0.90% (-0.098)#341 | 1.1% (-0.292)#11,008 |
| 16. | 43209 | 0.79% | 0.90% (-0.106)#344 | 1.1% (-0.299)#11,084 |
| 17. | 43206 | 0.74% | 0.90% (-0.160)#359 | 1.1% (-0.354)#11,634 |
| 18. | 43230 | 0.68% | 0.90% (-0.223)#374 | 1.1% (-0.416)#12,351 |
| 19. | 43228 | 0.64% | 0.90% (-0.256)#389 | 1.1% (-0.450)#12,765 |
| 20. | 43207 | 0.61% | 0.90% (-0.292)#406 | 1.1% (-0.485)#13,218 |
| 21. | 43205 | 0.58% | 0.90% (-0.319)#423 | 1.1% (-0.512)#13,560 |
| 22. | 43224 | 0.54% | 0.90% (-0.354)#444 | 1.1% (-0.547)#13,981 |
| 23. | 43232 | 0.53% | 0.90% (-0.363)#447 | 1.1% (-0.557)#14,095 |
| 24. | 43203 | 0.36% | 0.90% (-0.534)#526 | 1.1% (-0.727)#16,233 |
| 25. | 43213 | 0.26% | 0.90% (-0.640)#585 | 1.1% (-0.833)#17,555 |
| 26. | 43229 | 0.24% | 0.90% (-0.661)#600 | 1.1% (-0.855)#17,795 |
| 27. | 43227 | 0.22% | 0.90% (-0.682)#611 | 1.1% (-0.876)#18,025 |
| 28. | 43223 | 0.15% | 0.90% (-0.748)#651 | 1.1% (-0.941)#18,686 |
1
Common Questions
What are the Top 10 Zip Codes with the Highest Percentage of Population Employed in Life, Physical & Social Science in Columbus, OH?
Top 10 Zip Codes with the Highest Percentage of Population Employed in Life, Physical & Social Science in Columbus, OH are:
What zip code has the Highest Percentage of Population Employed in Life, Physical & Social Science in Columbus, OH?
43210 has the Highest Percentage of Population Employed in Life, Physical & Social Science in Columbus, OH with 5.7%.
What is the Percentage of Population Employed in Life, Physical & Social Science in Columbus, OH?
Percentage of Population Employed in Life, Physical & Social Science in Columbus is 1.2%.
What is the Percentage of Population Employed in Life, Physical & Social Science in Ohio?
Percentage of Population Employed in Life, Physical & Social Science in Ohio is 0.90%.
What is the Percentage of Population Employed in Life, Physical & Social Science in the United States?
Percentage of Population Employed in Life, Physical & Social Science in the United States is 1.1%.