Zip Codes with the Highest Percentage of Population Employed in Life, Physical & Social Science in Cleveland, OH

RELATED REPORTS & OPTIONS

Life, Physical & Social Science
Population
Families and Households
Female Fertility
Female Fertility (Unmarried)
Race (Community Size)
Race (Percentage)
Ancestry (Community Size)
AfghanAfricanAlbanianAlsatianAmericanApacheArabArgentineanArmenianAustralianAustrianBahamianBangladeshiBarbadianBelgianBelizeanBhutaneseBlackfeetBrazilianBritishBritish West IndianBulgarianBurmeseCajunCambodianCanadianCape VerdeanCarpatho RusynCelticCentral AmericanCentral American IndianCherokeeChickasawChileanChippewaChoctawColombianComancheCosta RicanCreekCroatianCubanCzechCzechoslovakianDanishDelawareDominicanDutchDutch West IndianEastern EuropeanEcuadorianEgyptianEnglishEstonianEthiopianEuropeanFilipinoFinnishFrenchFrench American IndianFrench CanadianGermanGhanaianGreekGuamanian / ChamorroGuatemalanGuyaneseHaitianHonduranHungarianIcelanderIndian (Asian)IndonesianIranianIraqiIrishIroquoisIsraeliItalianJamaicanJapaneseJordanianKoreanLaotianLatvianLebaneseLiberianLithuanianLumbeeLuxembourgerMacedonianMalaysianMexicanMexican American IndianMongolianMoroccanNative HawaiianNavajoNicaraguanNigerianNorthern EuropeanNorwegianPakistaniPalestinianPanamanianParaguayanPennsylvania GermanPeruvianPolishPortuguesePuebloPuerto RicanRomanianRussianSalvadoranSamoanScandinavianScotch-IrishScottishSeminoleSerbianSierra LeoneanSiouxSlavicSlovakSloveneSomaliSouth AfricanSouth AmericanSouth American IndianSpaniardSpanishSri LankanSubsaharan AfricanSudaneseSwedishSwissSyrianThaiTrinidadian and TobagonianTurkishU.S. Virgin IslanderUgandanUkrainianUruguayanVenezuelanVietnameseWelshWest IndianYaquiYugoslavianZimbabwean
Ancestry (Percentage)
AfghanAfricanAlbanianAlsatianAmericanApacheArabArgentineanArmenianAustralianAustrianBahamianBangladeshiBarbadianBelgianBelizeanBhutaneseBlackfeetBrazilianBritishBritish West IndianBulgarianBurmeseCajunCambodianCanadianCape VerdeanCarpatho RusynCelticCentral AmericanCentral American IndianCherokeeChickasawChileanChippewaChoctawColombianComancheCosta RicanCreekCroatianCubanCzechCzechoslovakianDanishDelawareDominicanDutchDutch West IndianEastern EuropeanEcuadorianEgyptianEnglishEstonianEthiopianEuropeanFilipinoFinnishFrenchFrench American IndianFrench CanadianGermanGhanaianGreekGuamanian / ChamorroGuatemalanGuyaneseHaitianHonduranHungarianIcelanderIndian (Asian)IndonesianIranianIraqiIrishIroquoisIsraeliItalianJamaicanJapaneseJordanianKoreanLaotianLatvianLebaneseLiberianLithuanianLumbeeLuxembourgerMacedonianMalaysianMexicanMexican American IndianMongolianMoroccanNative HawaiianNavajoNicaraguanNigerianNorthern EuropeanNorwegianPakistaniPalestinianPanamanianParaguayanPennsylvania GermanPeruvianPolishPortuguesePuebloPuerto RicanRomanianRussianSalvadoranSamoanScandinavianScotch-IrishScottishSeminoleSerbianSierra LeoneanSiouxSlavicSlovakSloveneSomaliSouth AfricanSouth AmericanSouth American IndianSpaniardSpanishSri LankanSubsaharan AfricanSudaneseSwedishSwissSyrianThaiTrinidadian and TobagonianTurkishU.S. Virgin IslanderUgandanUkrainianUruguayanVenezuelanVietnameseWelshWest IndianYaquiYugoslavianZimbabwean
Immigrant Origin (Total)
AfghanistanAfricaAlbaniaArgentinaAsiaAustraliaAustriaBangladeshBarbadosBelarusBelgiumBelizeBosnia and HerzegovinaBrazilBulgariaBurma / MyanmarCambodiaCanadaCaribbeanCentral AmericaChileChinaColombiaCongoCosta RicaCroatiaCubaCzechoslovakiaDominican RepublicEastern AfricaEastern AsiaEastern EuropeEcuadorEgyptEl SalvadorEnglandEthiopiaEuropeFranceGermanyGhanaGreeceGuatemalaGuyanaHaitiHondurasHong KongHungaryIndiaIndonesiaIranIraqIrelandIsraelItalyJamaicaJapanJordanKazakhstanKenyaKoreaKuwaitLaosLatin AmericaLatviaLebanonLiberiaLithuaniaMalaysiaMexicoMiddle AfricaMoldovaMoroccoNepalNetherlandsNicaraguaNigeriaNorthern AfricaNorthern EuropeOceaniaPakistanPanamaPeruPhilippinesPolandRomaniaRussiaSaudi ArabiaScotlandSerbiaSierra LeoneSingaporeSomaliaSouth AfricaSouth AmericaSouth Central AsiaSouth Eastern AsiaSouthern EuropeSpainSri LankaSudanSwedenSyriaTaiwanThailandTrinidad and TobagoTurkeyUgandaUkraineUruguayUzbekistanVenezuelaVietnamWest IndiesWestern AfricaWestern AsiaWestern EuropeZaireZimbabwe
Immigrant Origin (Percentage)
AfghanistanAfricaAlbaniaArgentinaAsiaAustraliaAustriaBangladeshBarbadosBelarusBelgiumBelizeBosnia and HerzegovinaBrazilBulgariaBurma / MyanmarCambodiaCanadaCaribbeanCentral AmericaChileChinaColombiaCongoCosta RicaCroatiaCubaCzechoslovakiaDominican RepublicEastern AfricaEastern AsiaEastern EuropeEcuadorEgyptEl SalvadorEnglandEthiopiaEuropeFranceGermanyGhanaGreeceGuatemalaGuyanaHaitiHondurasHong KongHungaryIndiaIndonesiaIranIraqIrelandIsraelItalyJamaicaJapanJordanKazakhstanKenyaKoreaKuwaitLaosLatin AmericaLatviaLebanonLiberiaLithuaniaMalaysiaMexicoMiddle AfricaMoldovaMoroccoNepalNetherlandsNicaraguaNigeriaNorthern AfricaNorthern EuropeOceaniaPakistanPanamaPeruPhilippinesPolandRomaniaRussiaSaudi ArabiaScotlandSerbiaSierra LeoneSingaporeSomaliaSouth AfricaSouth AmericaSouth Central AsiaSouth Eastern AsiaSouthern EuropeSpainSri LankaSudanSwedenSyriaTaiwanThailandTrinidad and TobagoTurkeyUgandaUkraineUruguayUzbekistanVenezuelaVietnamWest IndiesWestern AfricaWestern AsiaWestern EuropeZaireZimbabwe
Income
Income (Families)
Income (Households)
Poverty
Poverty (Families)
Unemployment
Employment Occupations
Employment Industries
Employer Class
Commute Time
Commute Means
School Enrollment
Education by Degree Field
Occupancy
Finances
Physical Characteristics
Cleveland
Compare Zip Codes
Comparison Subject

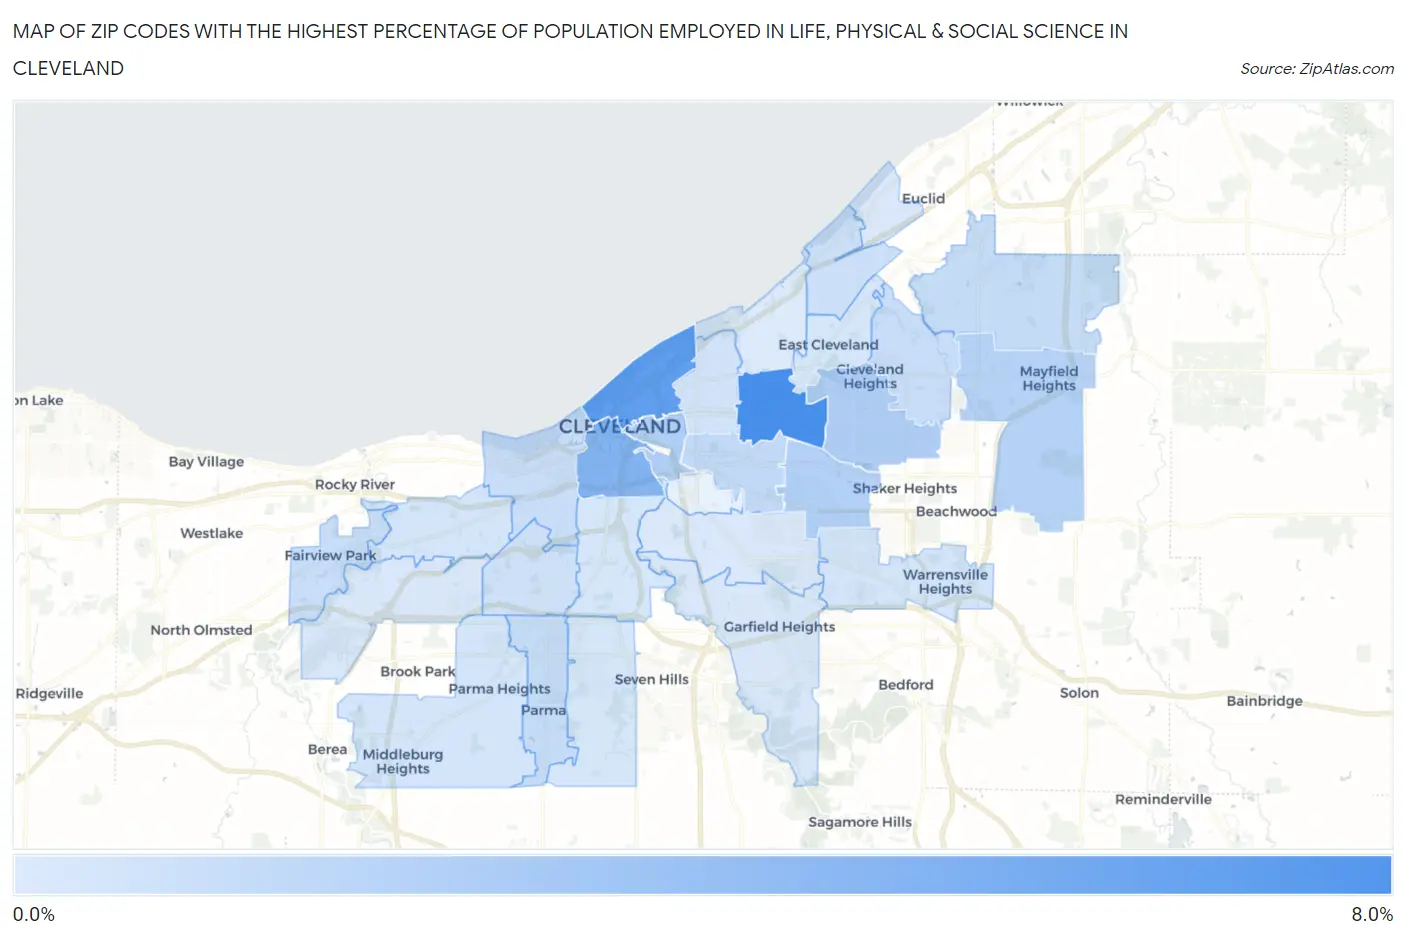
Map of Zip Codes with the Highest Percentage of Population Employed in Life, Physical & Social Science in Cleveland

0.0%
8.0%
Zip Codes with the Highest Percentage of Population Employed in Life, Physical & Social Science in Cleveland Map

Zip Codes with the Highest Percentage of Population Employed in Life, Physical & Social Science in Cleveland, OH

Zip Code % Employed vs State vs National
1.441066.3%0.90%(+5.38)#101.1%(+5.19)#508
2.441145.2%0.90%(+4.31)#171.1%(+4.11)#708
3.441133.8%0.90%(+2.87)#241.1%(+2.68)#1,280
4.441182.0%0.90%(+1.09)#1001.1%(+0.900)#3,713
5.441151.9%0.90%(+1.03)#1081.1%(+0.841)#3,880
6.441201.9%0.90%(+0.968)#1121.1%(+0.774)#4,091
7.441241.7%0.90%(+0.806)#1311.1%(+0.613)#4,708
8.441041.3%0.90%(+0.403)#1851.1%(+0.210)#6,797
9.441431.1%0.90%(+0.211)#2271.1%(+0.018)#8,163
10.441291.1%0.90%(+0.204)#2281.1%(+0.011)#8,202
11.441211.0%0.90%(+0.127)#2531.1%(-0.067)#8,841
12.441261.0%0.90%(+0.125)#2541.1%(-0.068)#8,858
13.441020.98%0.90%(+0.078)#2731.1%(-0.116)#9,268
14.441100.81%0.90%(-0.091)#3351.1%(-0.285)#10,936
15.441440.75%0.90%(-0.147)#3531.1%(-0.340)#11,502
16.441030.62%0.90%(-0.278)#3981.1%(-0.471)#13,044
17.441300.58%0.90%(-0.313)#4211.1%(-0.506)#13,495
18.441110.57%0.90%(-0.327)#4261.1%(-0.521)#13,649
19.441280.53%0.90%(-0.364)#4481.1%(-0.557)#14,104
20.441090.47%0.90%(-0.429)#4741.1%(-0.622)#14,914
21.441340.46%0.90%(-0.435)#4771.1%(-0.629)#14,995
22.441120.45%0.90%(-0.447)#4841.1%(-0.641)#15,134
23.441250.41%0.90%(-0.487)#5071.1%(-0.680)#15,607
24.441350.33%0.90%(-0.572)#5511.1%(-0.765)#16,725
25.441190.27%0.90%(-0.623)#5781.1%(-0.816)#17,354
26.441050.25%0.90%(-0.651)#5921.1%(-0.844)#17,666
27.441080.19%0.90%(-0.710)#6311.1%(-0.903)#18,331

Common Questions

What are the Top 10 Zip Codes with the Highest Percentage of Population Employed in Life, Physical & Social Science in Cleveland, OH?
Top 10 Zip Codes with the Highest Percentage of Population Employed in Life, Physical & Social Science in Cleveland, OH are:
#1
6.3%
#2
5.2%
#3
3.8%
#4
2.0%
#5
1.9%
#6
1.9%
#7
1.7%
#8
1.3%
#9
1.1%
#10
1.1%
What zip code has the Highest Percentage of Population Employed in Life, Physical & Social Science in Cleveland, OH?
44106 has the Highest Percentage of Population Employed in Life, Physical & Social Science in Cleveland, OH with 6.3%.
What is the Percentage of Population Employed in Life, Physical & Social Science in Cleveland, OH?
Percentage of Population Employed in Life, Physical & Social Science in Cleveland is 1.2%.
What is the Percentage of Population Employed in Life, Physical & Social Science in Ohio?
Percentage of Population Employed in Life, Physical & Social Science in Ohio is 0.90%.
What is the Percentage of Population Employed in Life, Physical & Social Science in the United States?
Percentage of Population Employed in Life, Physical & Social Science in the United States is 1.1%.