Zip Codes with the Highest Percentage of Population Employed in Life, Physical & Social Science in Dayton, OH
RELATED REPORTS & OPTIONS
Life, Physical & Social Science
Dayton
Compare Zip Codes
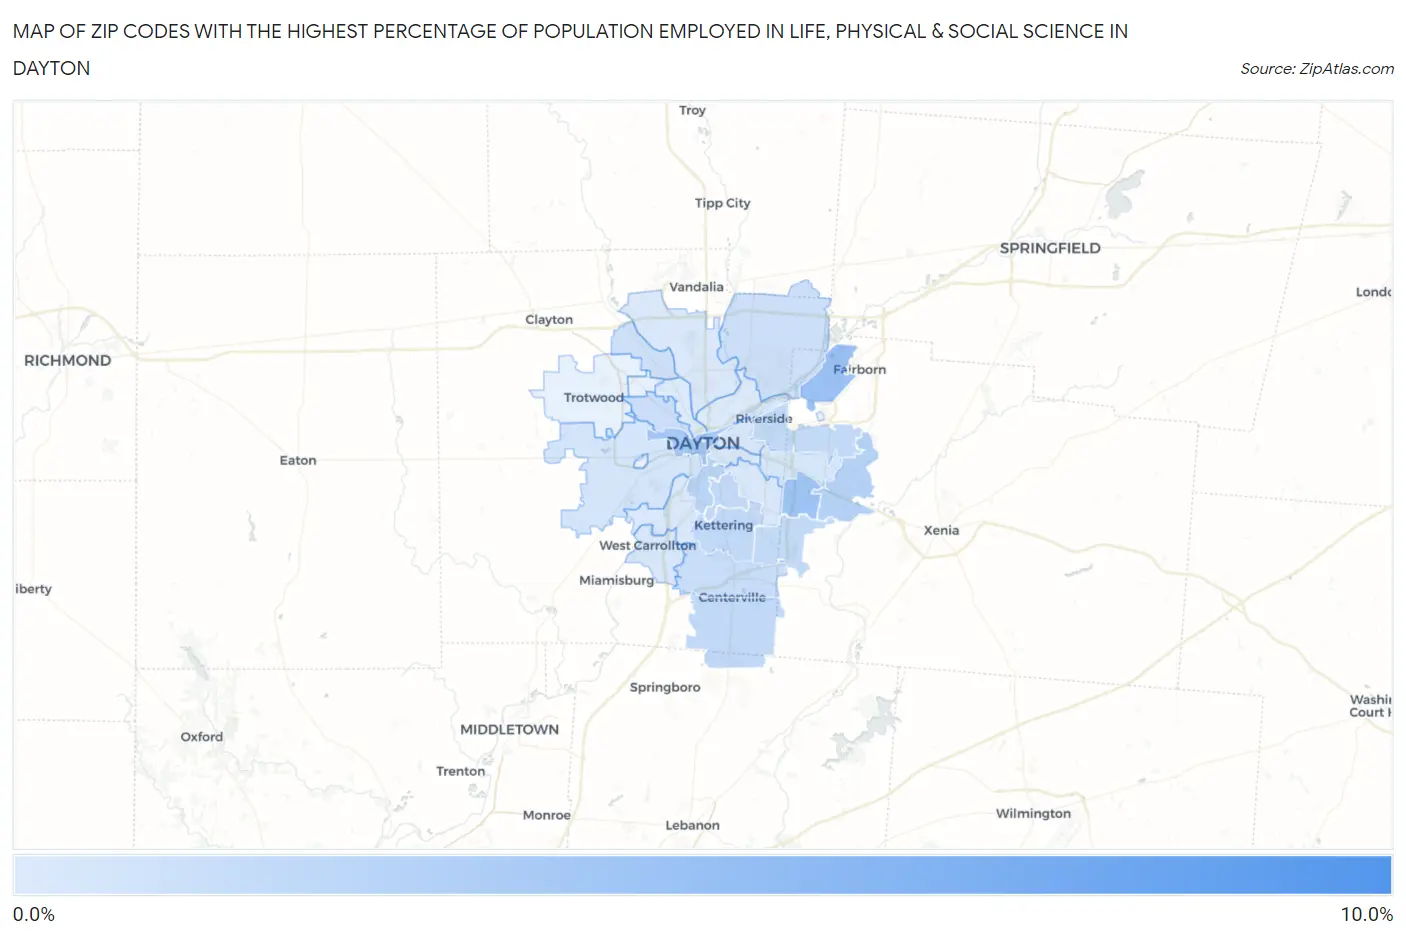
Map of Zip Codes with the Highest Percentage of Population Employed in Life, Physical & Social Science in Dayton
0.20%
8.5%
Zip Codes with the Highest Percentage of Population Employed in Life, Physical & Social Science in Dayton, OH
| Zip Code | % Employed | vs State | vs National | |
| 1. | 45469 | 8.5% | 0.90%(+7.58)#7 | 1.1%(+7.38)#287 |
| 2. | 45433 | 3.7% | 0.90%(+2.77)#26 | 1.1%(+2.57)#1,335 |
| 3. | 45430 | 3.6% | 0.90%(+2.72)#29 | 1.1%(+2.53)#1,360 |
| 4. | 45402 | 3.2% | 0.90%(+2.33)#38 | 1.1%(+2.13)#1,651 |
| 5. | 45434 | 2.3% | 0.90%(+1.36)#83 | 1.1%(+1.16)#3,055 |
| 6. | 45409 | 2.1% | 0.90%(+1.18)#98 | 1.1%(+0.987)#3,471 |
| 7. | 45458 | 1.7% | 0.90%(+0.814)#129 | 1.1%(+0.621)#4,667 |
| 8. | 45419 | 1.7% | 0.90%(+0.776)#134 | 1.1%(+0.583)#4,847 |
| 9. | 45429 | 1.6% | 0.90%(+0.738)#136 | 1.1%(+0.544)#5,013 |
| 10. | 45440 | 1.5% | 0.90%(+0.642)#149 | 1.1%(+0.448)#5,448 |
| 11. | 45431 | 1.5% | 0.90%(+0.620)#152 | 1.1%(+0.426)#5,559 |
| 12. | 45459 | 1.3% | 0.90%(+0.353)#195 | 1.1%(+0.159)#7,130 |
| 13. | 45406 | 1.2% | 0.90%(+0.266)#216 | 1.1%(+0.072)#7,776 |
| 14. | 45424 | 1.0% | 0.90%(+0.104)#264 | 1.1%(-0.089)#9,033 |
| 15. | 45415 | 0.98% | 0.90%(+0.082)#272 | 1.1%(-0.111)#9,234 |
| 16. | 45417 | 0.64% | 0.90%(-0.261)#391 | 1.1%(-0.454)#12,823 |
| 17. | 45432 | 0.53% | 0.90%(-0.366)#451 | 1.1%(-0.559)#14,137 |
| 18. | 45420 | 0.46% | 0.90%(-0.441)#480 | 1.1%(-0.634)#15,063 |
| 19. | 45403 | 0.45% | 0.90%(-0.446)#482 | 1.1%(-0.640)#15,120 |
| 20. | 45449 | 0.43% | 0.90%(-0.471)#499 | 1.1%(-0.664)#15,406 |
| 21. | 45414 | 0.34% | 0.90%(-0.560)#541 | 1.1%(-0.754)#16,575 |
| 22. | 45439 | 0.31% | 0.90%(-0.586)#560 | 1.1%(-0.779)#16,922 |
| 23. | 45410 | 0.31% | 0.90%(-0.592)#564 | 1.1%(-0.785)#16,999 |
| 24. | 45404 | 0.24% | 0.90%(-0.658)#597 | 1.1%(-0.852)#17,765 |
| 25. | 45405 | 0.20% | 0.90%(-0.697)#623 | 1.1%(-0.890)#18,191 |
1
Common Questions
What are the Top 10 Zip Codes with the Highest Percentage of Population Employed in Life, Physical & Social Science in Dayton, OH?
Top 10 Zip Codes with the Highest Percentage of Population Employed in Life, Physical & Social Science in Dayton, OH are:
What zip code has the Highest Percentage of Population Employed in Life, Physical & Social Science in Dayton, OH?
45469 has the Highest Percentage of Population Employed in Life, Physical & Social Science in Dayton, OH with 8.5%.
What is the Percentage of Population Employed in Life, Physical & Social Science in Dayton, OH?
Percentage of Population Employed in Life, Physical & Social Science in Dayton is 0.91%.
What is the Percentage of Population Employed in Life, Physical & Social Science in Ohio?
Percentage of Population Employed in Life, Physical & Social Science in Ohio is 0.90%.
What is the Percentage of Population Employed in Life, Physical & Social Science in the United States?
Percentage of Population Employed in Life, Physical & Social Science in the United States is 1.1%.