Zip Codes with the Highest Percentage of Population Employed in Life, Physical & Social Science in Schenectady, NY

RELATED REPORTS & OPTIONS

Life, Physical & Social Science
Population
Families and Households
Female Fertility
Female Fertility (Unmarried)
Race (Community Size)
Race (Percentage)
Ancestry (Community Size)
AfghanAfricanAmericanArabArmenianAustralianAustrianBahamianBarbadianBelgianBhutaneseBlackfeetBritishBritish West IndianBurmeseCambodianCanadianCentral AmericanCentral American IndianCherokeeColombianCosta RicanCroatianCubanCzechCzechoslovakianDanishDominicanDutchEastern EuropeanEcuadorianEgyptianEnglishEuropeanFinnishFrenchFrench American IndianFrench CanadianGermanGhanaianGreekGuatemalanGuyaneseHaitianHonduranHungarianIndian (Asian)IndonesianIranianIrishIroquoisIsraeliItalianJamaicanKoreanLatvianLebaneseLithuanianMexicanMexican American IndianMoroccanNative HawaiianNicaraguanNigerianNorthern EuropeanNorwegianPanamanianPennsylvania GermanPolishPortuguesePuerto RicanRomanianRussianSalvadoranScandinavianScotch-IrishScottishSiouxSlavicSlovakSloveneSouth AmericanSouth American IndianSpaniardSpanishSri LankanSubsaharan AfricanSwedishSwissSyrianThaiTrinidadian and TobagonianTurkishUkrainianVenezuelanVietnameseWelshWest Indian
Ancestry (Percentage)
AfghanAfricanAmericanArabArmenianAustralianAustrianBahamianBarbadianBelgianBhutaneseBlackfeetBritishBritish West IndianBurmeseCambodianCanadianCentral AmericanCentral American IndianCherokeeColombianCosta RicanCroatianCubanCzechCzechoslovakianDanishDominicanDutchEastern EuropeanEcuadorianEgyptianEnglishEuropeanFinnishFrenchFrench American IndianFrench CanadianGermanGhanaianGreekGuatemalanGuyaneseHaitianHonduranHungarianIndian (Asian)IndonesianIranianIrishIroquoisIsraeliItalianJamaicanKoreanLatvianLebaneseLithuanianMexicanMexican American IndianMoroccanNative HawaiianNicaraguanNigerianNorthern EuropeanNorwegianPanamanianPennsylvania GermanPolishPortuguesePuerto RicanRomanianRussianSalvadoranScandinavianScotch-IrishScottishSiouxSlavicSlovakSloveneSouth AmericanSouth American IndianSpaniardSpanishSri LankanSubsaharan AfricanSwedishSwissSyrianThaiTrinidadian and TobagonianTurkishUkrainianVenezuelanVietnameseWelshWest Indian
Immigrant Origin (Total)
Immigrant Origin (Percentage)
Income
Income (Families)
Income (Households)
Poverty
Poverty (Families)
Unemployment
Employment Occupations
Employment Industries
Employer Class
Commute Time
Commute Means
School Enrollment
Education by Degree Field
Occupancy
Finances
Physical Characteristics
Schenectady
Compare Zip Codes
Comparison Subject

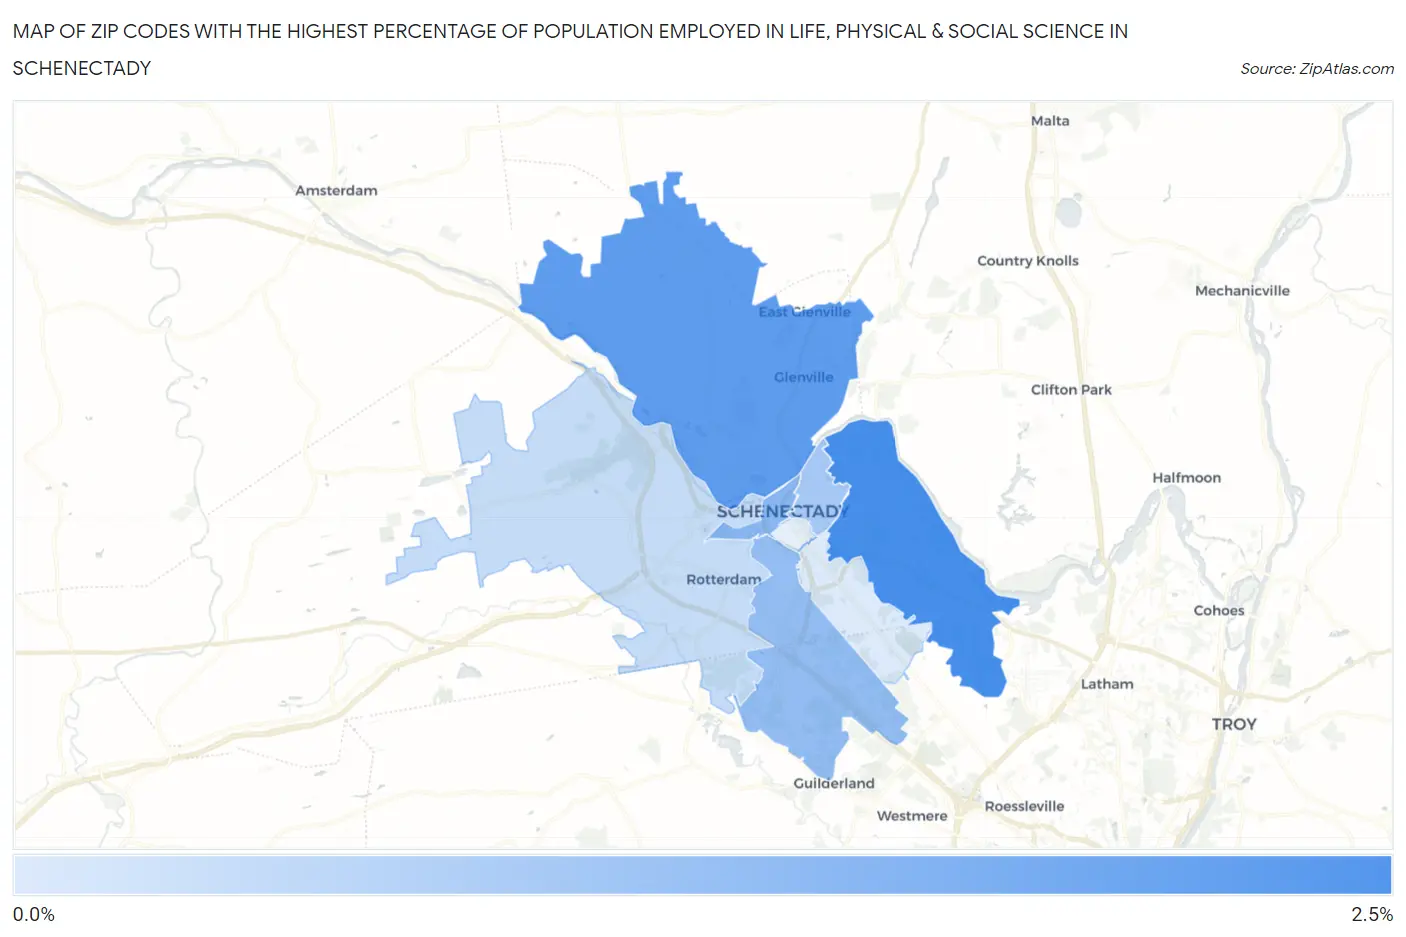
Map of Zip Codes with the Highest Percentage of Population Employed in Life, Physical & Social Science in Schenectady

0.0%
2.5%
Zip Codes with the Highest Percentage of Population Employed in Life, Physical & Social Science in Schenectady Map

Zip Codes with the Highest Percentage of Population Employed in Life, Physical & Social Science in Schenectady, NY

Zip Code % Employed vs State vs National
1.123092.3%1.1%(+1.25)#1791.1%(+1.24)#2,877
2.123022.0%1.1%(+0.947)#2191.1%(+0.933)#3,616
3.123051.4%1.1%(+0.323)#3641.1%(+0.309)#6,193
4.123031.3%1.1%(+0.181)#4191.1%(+0.167)#7,081
5.123081.0%1.1%(-0.055)#5271.1%(-0.070)#8,874
6.123060.57%1.1%(-0.508)#8321.1%(-0.522)#13,667
7.123040.25%1.1%(-0.825)#1,0421.1%(-0.839)#17,615

Common Questions

What are the Top 5 Zip Codes with the Highest Percentage of Population Employed in Life, Physical & Social Science in Schenectady, NY?
Top 5 Zip Codes with the Highest Percentage of Population Employed in Life, Physical & Social Science in Schenectady, NY are:
#1
2.3%
#2
2.0%
#3
1.4%
#4
1.3%
#5
1.0%
What zip code has the Highest Percentage of Population Employed in Life, Physical & Social Science in Schenectady, NY?
12309 has the Highest Percentage of Population Employed in Life, Physical & Social Science in Schenectady, NY with 2.3%.
What is the Percentage of Population Employed in Life, Physical & Social Science in Schenectady, NY?
Percentage of Population Employed in Life, Physical & Social Science in Schenectady is 0.49%.
What is the Percentage of Population Employed in Life, Physical & Social Science in New York?
Percentage of Population Employed in Life, Physical & Social Science in New York is 1.1%.
What is the Percentage of Population Employed in Life, Physical & Social Science in the United States?
Percentage of Population Employed in Life, Physical & Social Science in the United States is 1.1%.