Zip Codes with the Highest Percentage of Population Employed in Food Preparation & Serving in Gardnerville, NV
RELATED REPORTS & OPTIONS
Food Preparation & Serving
Gardnerville
Compare Zip Codes
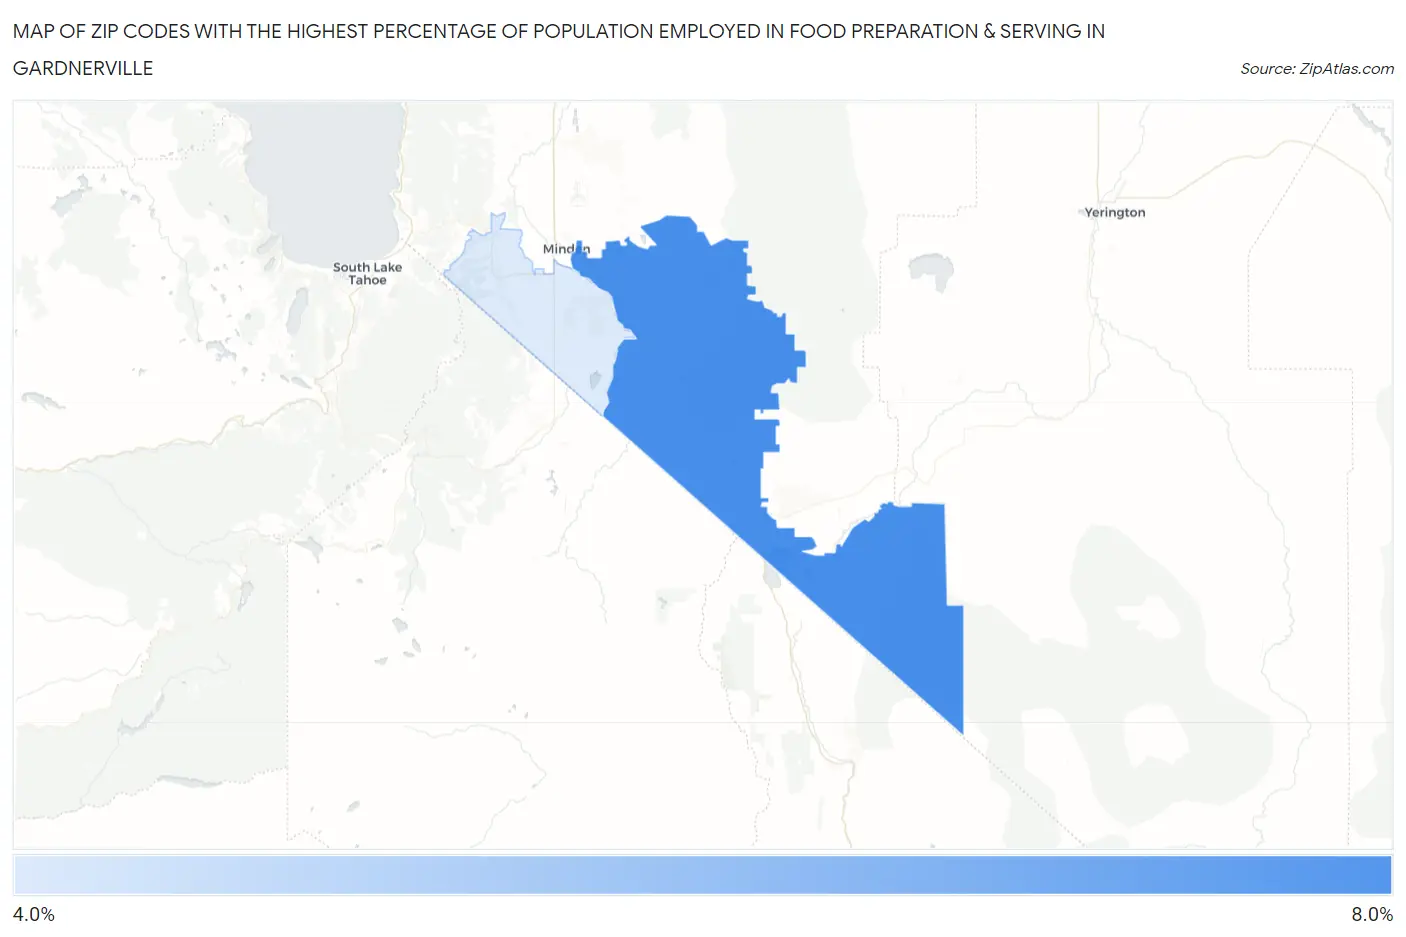
Map of Zip Codes with the Highest Percentage of Population Employed in Food Preparation & Serving in Gardnerville
4.6%
6.5%
Zip Codes with the Highest Percentage of Population Employed in Food Preparation & Serving in Gardnerville, NV
| Zip Code | % Employed | vs State | vs National | |
| 1. | 89410 | 6.5% | 8.6%(-2.13)#80 | 5.3%(+1.23)#7,844 |
| 2. | 89460 | 4.6% | 8.6%(-4.05)#101 | 5.3%(-0.695)#14,638 |
1
Common Questions
What are the Top Zip Codes with the Highest Percentage of Population Employed in Food Preparation & Serving in Gardnerville, NV?
Top Zip Codes with the Highest Percentage of Population Employed in Food Preparation & Serving in Gardnerville, NV are:
What zip code has the Highest Percentage of Population Employed in Food Preparation & Serving in Gardnerville, NV?
89410 has the Highest Percentage of Population Employed in Food Preparation & Serving in Gardnerville, NV with 6.5%.
What is the Percentage of Population Employed in Food Preparation & Serving in Gardnerville, NV?
Percentage of Population Employed in Food Preparation & Serving in Gardnerville is 7.9%.
What is the Percentage of Population Employed in Food Preparation & Serving in Nevada?
Percentage of Population Employed in Food Preparation & Serving in Nevada is 8.6%.
What is the Percentage of Population Employed in Food Preparation & Serving in the United States?
Percentage of Population Employed in Food Preparation & Serving in the United States is 5.3%.