Zip Codes with the Highest Percentage of Population Employed in Food Preparation & Serving in Henderson, NV
RELATED REPORTS & OPTIONS
Food Preparation & Serving
Henderson
Compare Zip Codes
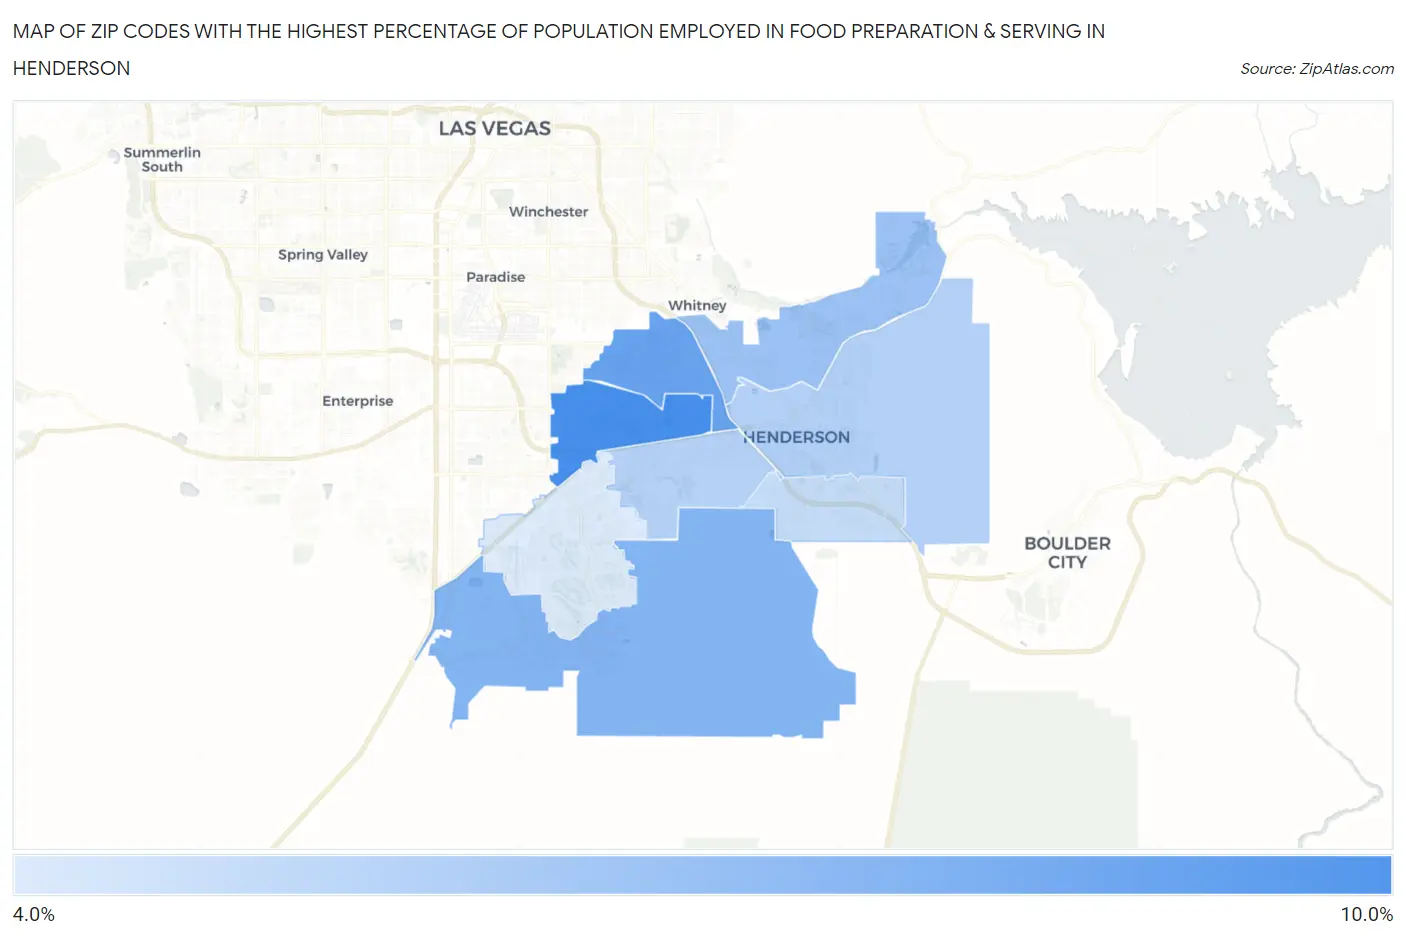
Map of Zip Codes with the Highest Percentage of Population Employed in Food Preparation & Serving in Henderson
4.8%
9.4%
Zip Codes with the Highest Percentage of Population Employed in Food Preparation & Serving in Henderson, NV
| Zip Code | % Employed | vs State | vs National | |
| 1. | 89074 | 9.4% | 8.6%(+0.711)#47 | 5.3%(+4.07)#3,186 |
| 2. | 89014 | 8.3% | 8.6%(-0.301)#64 | 5.3%(+3.05)#4,247 |
| 3. | 89044 | 7.5% | 8.6%(-1.13)#73 | 5.3%(+2.22)#5,546 |
| 4. | 89011 | 6.8% | 8.6%(-1.87)#79 | 5.3%(+1.49)#7,123 |
| 5. | 89015 | 6.0% | 8.6%(-2.60)#86 | 5.3%(+0.752)#9,216 |
| 6. | 89012 | 6.0% | 8.6%(-2.66)#88 | 5.3%(+0.691)#9,422 |
| 7. | 89002 | 5.5% | 8.6%(-3.15)#90 | 5.3%(+0.203)#11,103 |
| 8. | 89052 | 4.8% | 8.6%(-3.83)#97 | 5.3%(-0.474)#13,714 |
1
Common Questions
What are the Top 5 Zip Codes with the Highest Percentage of Population Employed in Food Preparation & Serving in Henderson, NV?
Top 5 Zip Codes with the Highest Percentage of Population Employed in Food Preparation & Serving in Henderson, NV are:
What zip code has the Highest Percentage of Population Employed in Food Preparation & Serving in Henderson, NV?
89074 has the Highest Percentage of Population Employed in Food Preparation & Serving in Henderson, NV with 9.4%.
What is the Percentage of Population Employed in Food Preparation & Serving in Henderson, NV?
Percentage of Population Employed in Food Preparation & Serving in Henderson is 6.6%.
What is the Percentage of Population Employed in Food Preparation & Serving in Nevada?
Percentage of Population Employed in Food Preparation & Serving in Nevada is 8.6%.
What is the Percentage of Population Employed in Food Preparation & Serving in the United States?
Percentage of Population Employed in Food Preparation & Serving in the United States is 5.3%.