Zip Codes with the Highest Percentage of Population Employed in Food Preparation & Serving in North Las Vegas, NV
RELATED REPORTS & OPTIONS
Food Preparation & Serving
North Las Vegas
Compare Zip Codes
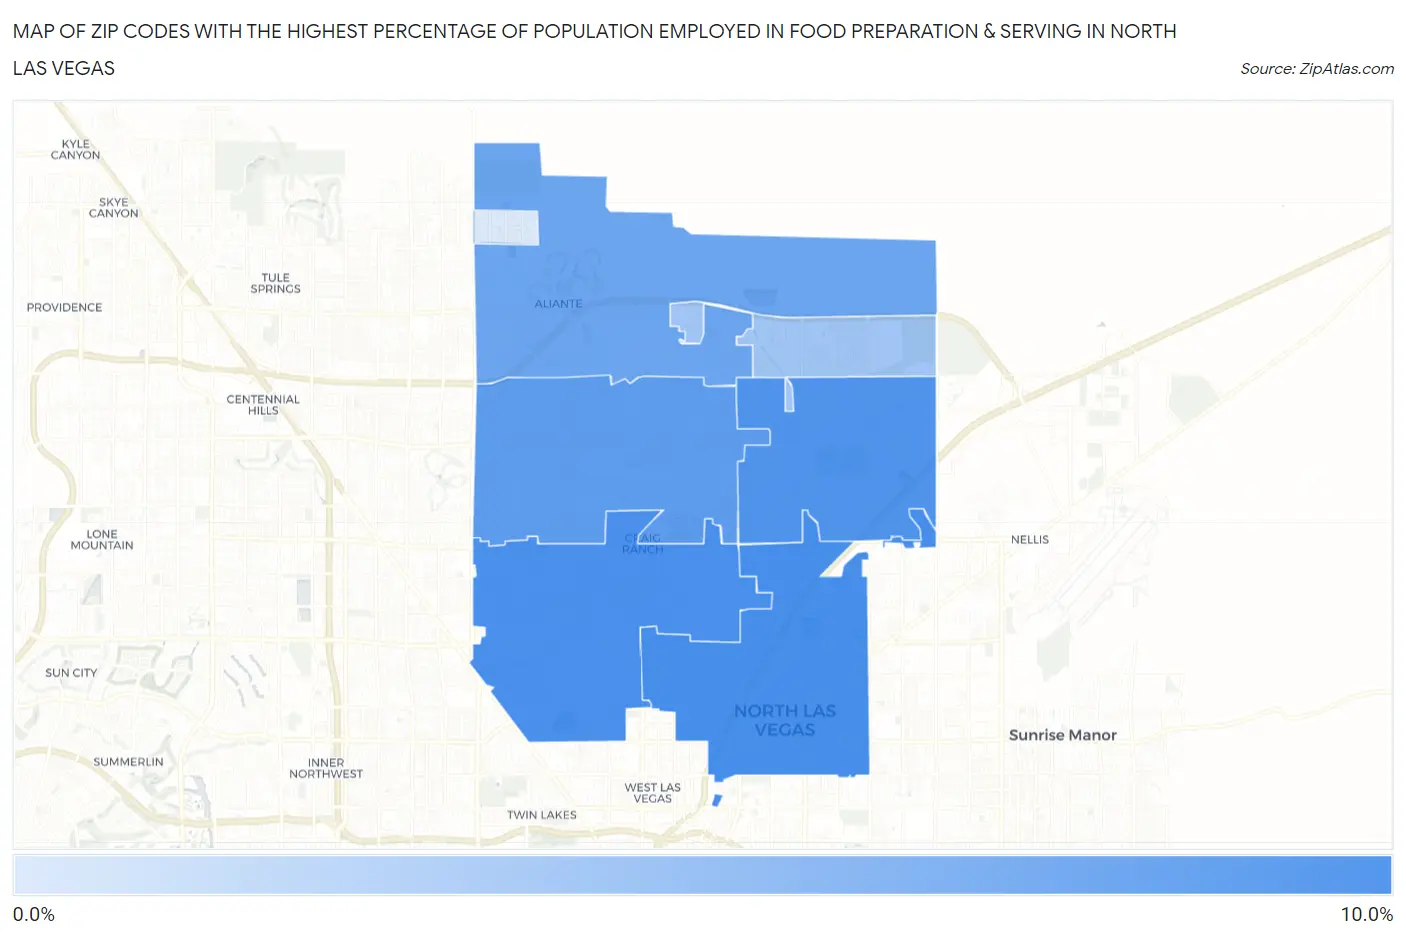
Map of Zip Codes with the Highest Percentage of Population Employed in Food Preparation & Serving in North Las Vegas
1.3%
9.6%
Zip Codes with the Highest Percentage of Population Employed in Food Preparation & Serving in North Las Vegas, NV
| Zip Code | % Employed | vs State | vs National | |
| 1. | 89030 | 9.6% | 8.6%(+0.993)#42 | 5.3%(+4.35)#2,941 |
| 2. | 89032 | 9.5% | 8.6%(+0.871)#44 | 5.3%(+4.23)#3,046 |
| 3. | 89081 | 9.1% | 8.6%(+0.434)#54 | 5.3%(+3.79)#3,448 |
| 4. | 89031 | 8.4% | 8.6%(-0.290)#63 | 5.3%(+3.07)#4,238 |
| 5. | 89084 | 7.5% | 8.6%(-1.10)#70 | 5.3%(+2.25)#5,486 |
| 6. | 89086 | 4.6% | 8.6%(-4.04)#100 | 5.3%(-0.687)#14,603 |
| 7. | 89085 | 1.3% | 8.6%(-7.30)#136 | 5.3%(-3.94)#26,318 |
1
Common Questions
What are the Top 5 Zip Codes with the Highest Percentage of Population Employed in Food Preparation & Serving in North Las Vegas, NV?
Top 5 Zip Codes with the Highest Percentage of Population Employed in Food Preparation & Serving in North Las Vegas, NV are:
What zip code has the Highest Percentage of Population Employed in Food Preparation & Serving in North Las Vegas, NV?
89030 has the Highest Percentage of Population Employed in Food Preparation & Serving in North Las Vegas, NV with 9.6%.
What is the Percentage of Population Employed in Food Preparation & Serving in North Las Vegas, NV?
Percentage of Population Employed in Food Preparation & Serving in North Las Vegas is 8.6%.
What is the Percentage of Population Employed in Food Preparation & Serving in Nevada?
Percentage of Population Employed in Food Preparation & Serving in Nevada is 8.6%.
What is the Percentage of Population Employed in Food Preparation & Serving in the United States?
Percentage of Population Employed in Food Preparation & Serving in the United States is 5.3%.