Zip Codes with the Highest Percentage of Population Employed in Arts, Entertainment & Recreation in Paterson, NJ
RELATED REPORTS & OPTIONS
Arts, Entertainment & Recreation
Paterson
Compare Zip Codes
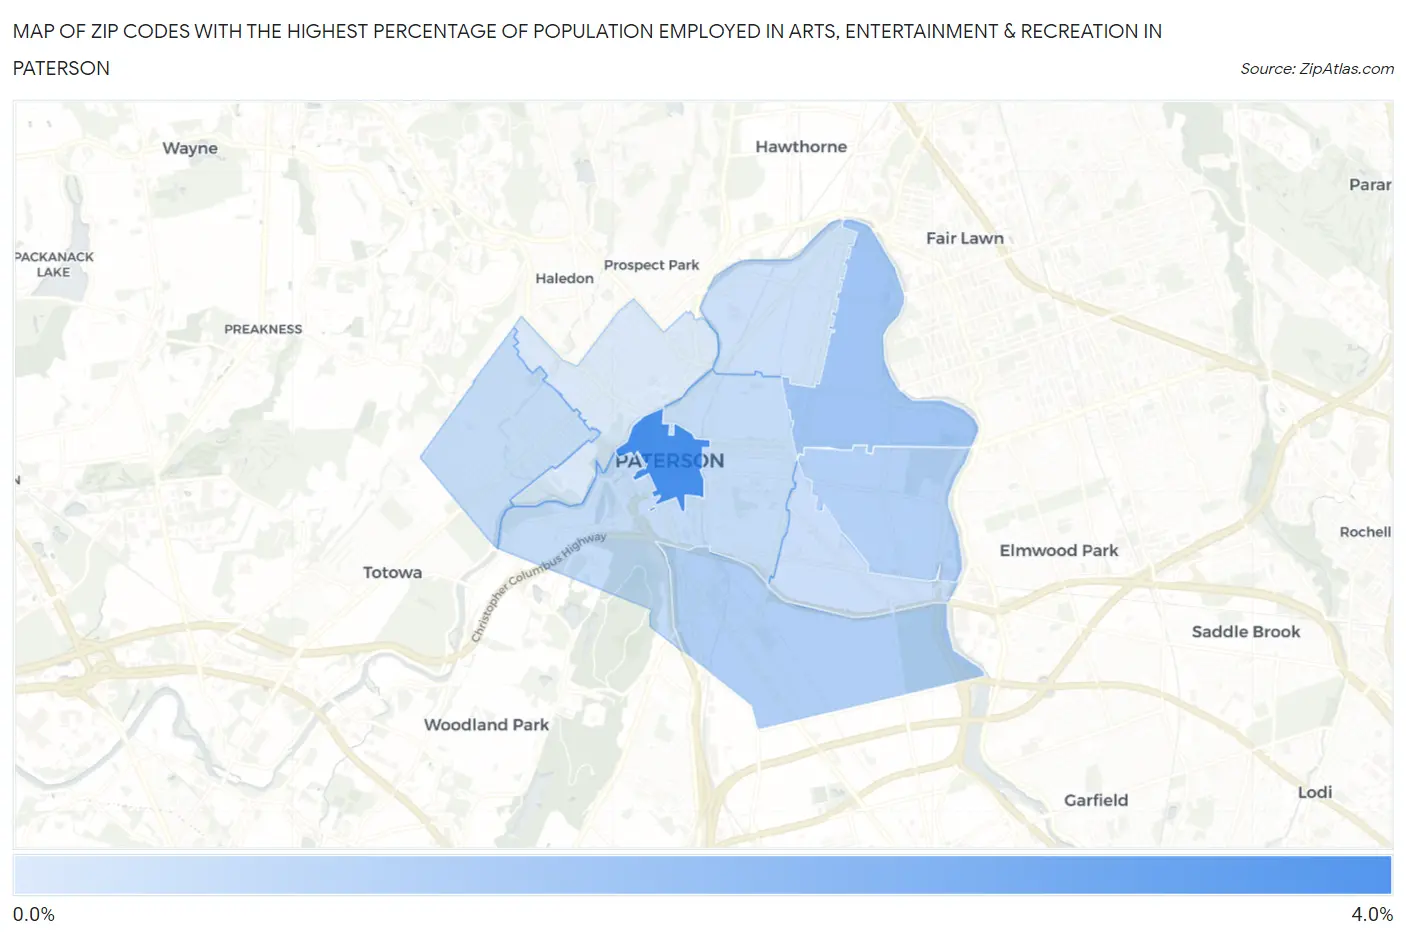
Map of Zip Codes with the Highest Percentage of Population Employed in Arts, Entertainment & Recreation in Paterson
0.21%
3.8%
Zip Codes with the Highest Percentage of Population Employed in Arts, Entertainment & Recreation in Paterson, NJ
| Zip Code | % Employed | vs State | vs National | |
| 1. | 07505 | 3.8% | 2.1%(+1.74)#72 | 2.1%(+1.73)#3,610 |
| 2. | 07514 | 1.6% | 2.1%(-0.426)#320 | 2.1%(-0.438)#12,128 |
| 3. | 07503 | 1.2% | 2.1%(-0.828)#397 | 2.1%(-0.840)#15,167 |
| 4. | 07504 | 1.2% | 2.1%(-0.875)#410 | 2.1%(-0.888)#15,515 |
| 5. | 07501 | 0.75% | 2.1%(-1.32)#491 | 2.1%(-1.33)#18,747 |
| 6. | 07502 | 0.74% | 2.1%(-1.33)#493 | 2.1%(-1.34)#18,835 |
| 7. | 07513 | 0.65% | 2.1%(-1.42)#509 | 2.1%(-1.43)#19,511 |
| 8. | 07524 | 0.58% | 2.1%(-1.49)#516 | 2.1%(-1.51)#19,986 |
| 9. | 07522 | 0.21% | 2.1%(-1.86)#538 | 2.1%(-1.87)#22,151 |
1
Common Questions
What are the Top 5 Zip Codes with the Highest Percentage of Population Employed in Arts, Entertainment & Recreation in Paterson, NJ?
Top 5 Zip Codes with the Highest Percentage of Population Employed in Arts, Entertainment & Recreation in Paterson, NJ are:
What zip code has the Highest Percentage of Population Employed in Arts, Entertainment & Recreation in Paterson, NJ?
07505 has the Highest Percentage of Population Employed in Arts, Entertainment & Recreation in Paterson, NJ with 3.8%.
What is the Percentage of Population Employed in Arts, Entertainment & Recreation in Paterson, NJ?
Percentage of Population Employed in Arts, Entertainment & Recreation in Paterson is 0.92%.
What is the Percentage of Population Employed in Arts, Entertainment & Recreation in New Jersey?
Percentage of Population Employed in Arts, Entertainment & Recreation in New Jersey is 2.1%.
What is the Percentage of Population Employed in Arts, Entertainment & Recreation in the United States?
Percentage of Population Employed in Arts, Entertainment & Recreation in the United States is 2.1%.