Zip Codes with the Highest Percentage of Households Heated by Bottled Gas / Liquid Propane in Paterson, NJ
RELATED REPORTS & OPTIONS
Bottled Gas / LP Heating
Paterson
Compare Zip Codes
Map of Zip Codes with the Highest Percentage of Households Heated by Bottled Gas / Liquid Propane in Paterson
1.1%
2.0%
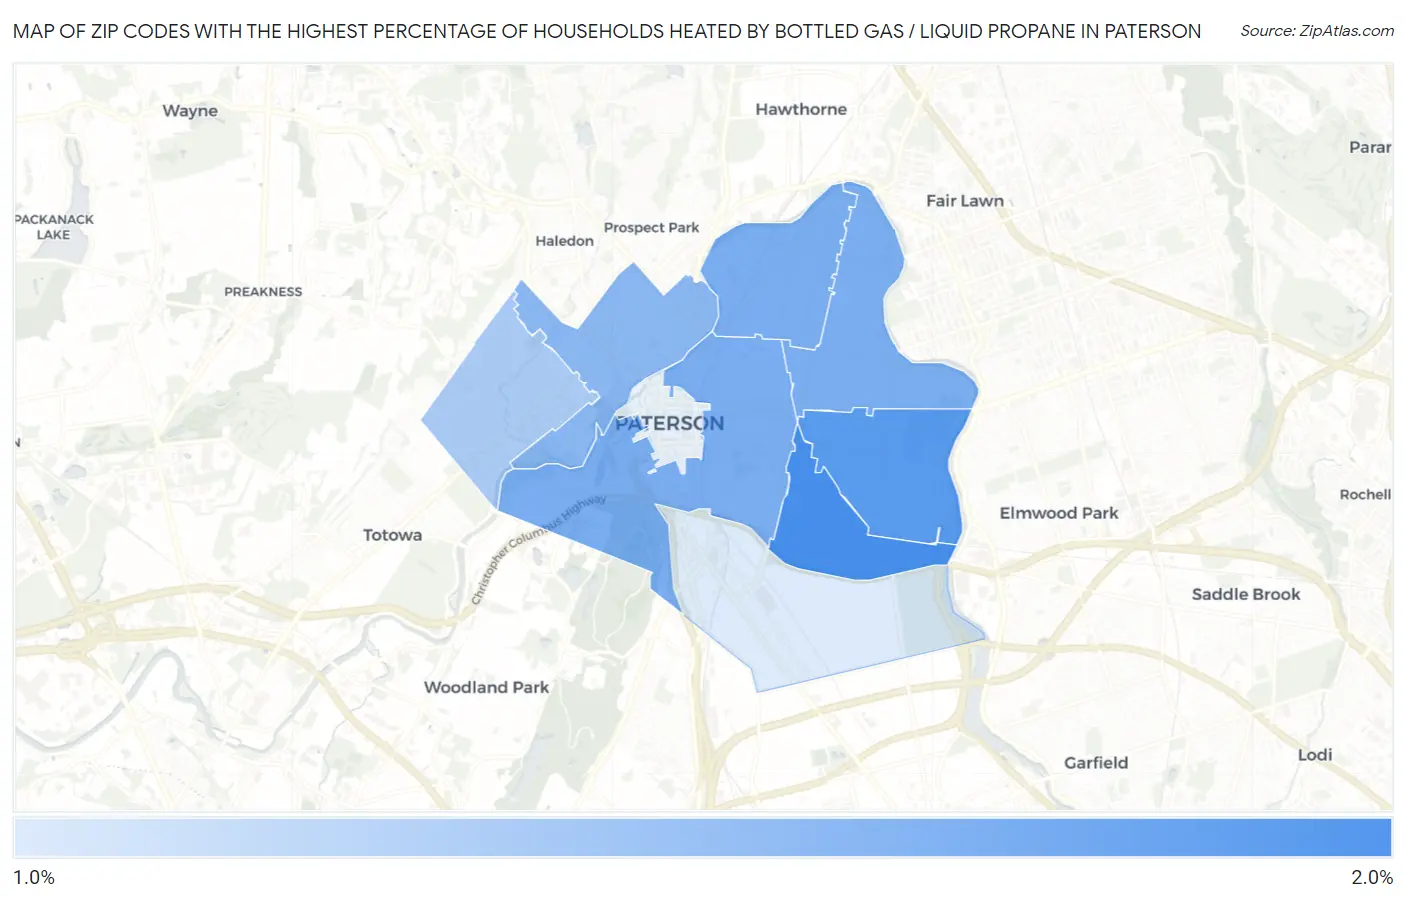
Zip Codes with the Highest Percentage of Households Heated by Bottled Gas / Liquid Propane in Paterson, NJ
| Zip Code | Bottled Gas / LP Heating | vs State | vs National | |
| 1. | 07513 | 2.0% | 2.4%(-0.400)#255 | 4.9%(-2.90)#23,276 |
| 2. | 07504 | 1.9% | 2.4%(-0.500)#266 | 4.9%(-3.00)#23,545 |
| 3. | 07501 | 1.7% | 2.4%(-0.700)#290 | 4.9%(-3.20)#24,007 |
| 4. | 07514 | 1.7% | 2.4%(-0.700)#292 | 4.9%(-3.20)#24,102 |
| 5. | 07524 | 1.7% | 2.4%(-0.700)#294 | 4.9%(-3.20)#24,126 |
| 6. | 07522 | 1.6% | 2.4%(-0.800)#314 | 4.9%(-3.30)#24,431 |
| 7. | 07502 | 1.4% | 2.4%(-1.00)#337 | 4.9%(-3.50)#25,196 |
| 8. | 07503 | 1.1% | 2.4%(-1.30)#384 | 4.9%(-3.80)#26,328 |
1
Common Questions
What are the Top 5 Zip Codes with the Highest Percentage of Households Heated by Bottled Gas / Liquid Propane in Paterson, NJ?
Top 5 Zip Codes with the Highest Percentage of Households Heated by Bottled Gas / Liquid Propane in Paterson, NJ are:
What zip code has the Highest Percentage of Households Heated by Bottled Gas / Liquid Propane in Paterson, NJ?
07513 has the Highest Percentage of Households Heated by Bottled Gas / Liquid Propane in Paterson, NJ with 2.0%.
What is the Percentage of Households Heated by Bottled Gas / Liquid Propane in Paterson, NJ?
Percentage of Households Heated by Bottled Gas / Liquid Propane in Paterson is 1.6%.
What is the Percentage of Households Heated by Bottled Gas / Liquid Propane in New Jersey?
Percentage of Households Heated by Bottled Gas / Liquid Propane in New Jersey is 2.4%.
What is the Percentage of Households Heated by Bottled Gas / Liquid Propane in the United States?
Percentage of Households Heated by Bottled Gas / Liquid Propane in the United States is 4.9%.