Zip Codes with the Highest Percentage of Households with Income Below $10,000 in Paterson, NJ
RELATED REPORTS & OPTIONS
Household Income | $0-10k
Paterson
Compare Zip Codes
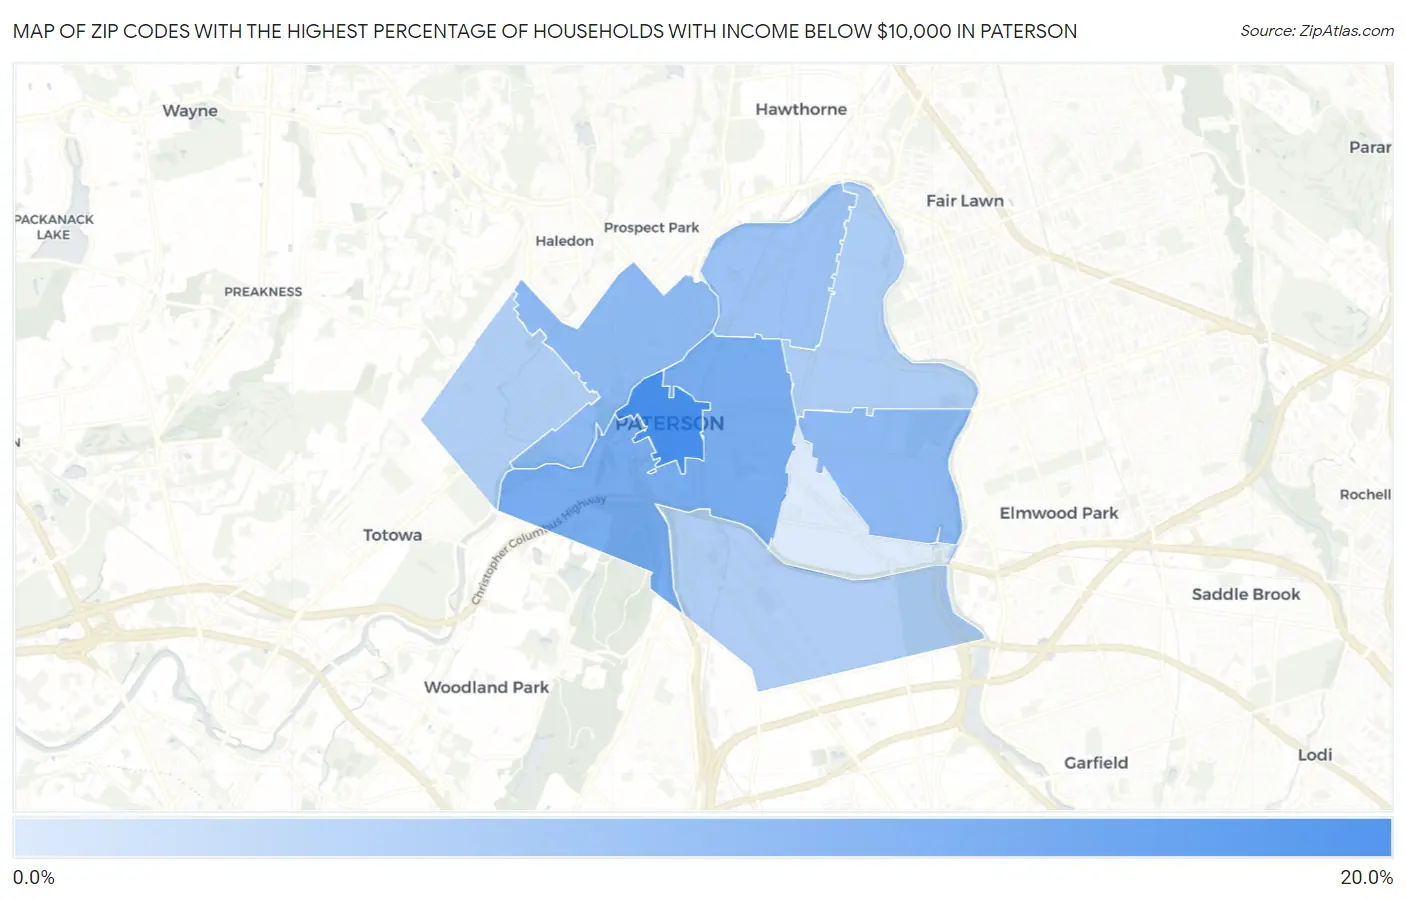
Map of Zip Codes with the Highest Percentage of Households with Income Below $10,000 in Paterson
1.1%
17.8%
Zip Codes with the Highest Percentage of Households with Income Below $10,000 in Paterson, NJ
| Zip Code | Households with Income < $10k | vs State | vs National | |
| 1. | 07505 | 17.8% | 4.1%(+13.7)#7 | 4.9%(+12.9)#1,047 |
| 2. | 07501 | 12.2% | 4.1%(+8.10)#15 | 4.9%(+7.30)#2,366 |
| 3. | 07504 | 9.8% | 4.1%(+5.70)#31 | 4.9%(+4.90)#3,725 |
| 4. | 07522 | 9.5% | 4.1%(+5.40)#32 | 4.9%(+4.60)#3,959 |
| 5. | 07524 | 8.1% | 4.1%(+4.00)#45 | 4.9%(+3.20)#5,428 |
| 6. | 07514 | 6.3% | 4.1%(+2.20)#69 | 4.9%(+1.40)#8,355 |
| 7. | 07503 | 5.9% | 4.1%(+1.80)#85 | 4.9%(+1.00)#9,247 |
| 8. | 07502 | 5.6% | 4.1%(+1.50)#93 | 4.9%(+0.700)#10,011 |
| 9. | 07513 | 1.1% | 4.1%(-3.00)#477 | 4.9%(-3.80)#26,554 |
1
Common Questions
What are the Top 5 Zip Codes with the Highest Percentage of Households with Income Below $10,000 in Paterson, NJ?
Top 5 Zip Codes with the Highest Percentage of Households with Income Below $10,000 in Paterson, NJ are:
What zip code has the Highest Percentage of Households with Income Below $10,000 in Paterson, NJ?
07505 has the Highest Percentage of Households with Income Below $10,000 in Paterson, NJ with 17.8%.
What is the Percentage of Households with Income Below $10,000 in Paterson, NJ?
Percentage of Households with Income Below $10,000 in Paterson is 8.6%.
What is the Percentage of Households with Income Below $10,000 in New Jersey?
Percentage of Households with Income Below $10,000 in New Jersey is 4.1%.
What is the Percentage of Households with Income Below $10,000 in the United States?
Percentage of Households with Income Below $10,000 in the United States is 4.9%.