Zip Codes with the Highest Percentage of Households with Income Above $200,000 in Paterson, NJ
RELATED REPORTS & OPTIONS
Household Income | $200k+
Paterson
Compare Zip Codes
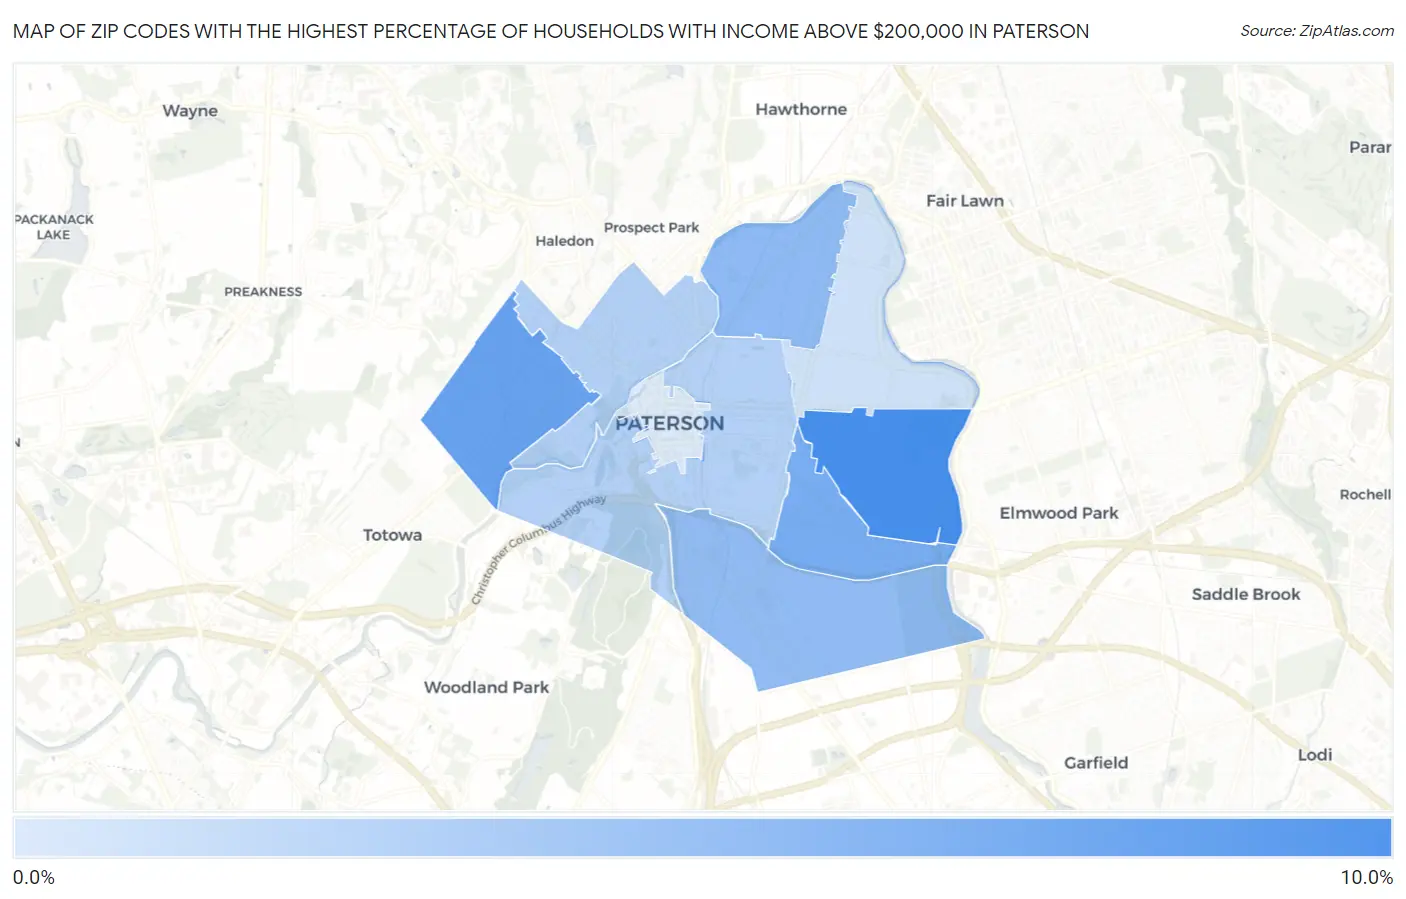
Map of Zip Codes with the Highest Percentage of Households with Income Above $200,000 in Paterson
0.60%
9.7%
Zip Codes with the Highest Percentage of Households with Income Above $200,000 in Paterson, NJ
| Zip Code | Households with Income > $200k | vs State | vs National | |
| 1. | 07504 | 9.7% | 19.2%(-9.50)#452 | 11.4%(-1.70)#8,568 |
| 2. | 07502 | 7.7% | 19.2%(-11.5)#479 | 11.4%(-3.70)#10,778 |
| 3. | 07513 | 6.7% | 19.2%(-12.5)#492 | 11.4%(-4.70)#12,251 |
| 4. | 07524 | 5.3% | 19.2%(-13.9)#513 | 11.4%(-6.10)#14,912 |
| 5. | 07503 | 5.1% | 19.2%(-14.1)#520 | 11.4%(-6.30)#15,337 |
| 6. | 07501 | 3.1% | 19.2%(-16.1)#550 | 11.4%(-8.30)#20,576 |
| 7. | 07522 | 3.0% | 19.2%(-16.2)#552 | 11.4%(-8.40)#20,907 |
| 8. | 07514 | 1.4% | 19.2%(-17.8)#565 | 11.4%(-10.00)#25,305 |
| 9. | 07505 | 0.60% | 19.2%(-18.6)#567 | 11.4%(-10.8)#26,954 |
1
Common Questions
What are the Top 5 Zip Codes with the Highest Percentage of Households with Income Above $200,000 in Paterson, NJ?
Top 5 Zip Codes with the Highest Percentage of Households with Income Above $200,000 in Paterson, NJ are:
What zip code has the Highest Percentage of Households with Income Above $200,000 in Paterson, NJ?
07504 has the Highest Percentage of Households with Income Above $200,000 in Paterson, NJ with 9.7%.
What is the Percentage of Households with Income Above $200,000 in Paterson, NJ?
Percentage of Households with Income Above $200,000 in Paterson is 4.5%.
What is the Percentage of Households with Income Above $200,000 in New Jersey?
Percentage of Households with Income Above $200,000 in New Jersey is 19.2%.
What is the Percentage of Households with Income Above $200,000 in the United States?
Percentage of Households with Income Above $200,000 in the United States is 11.4%.