Zip Codes with the Highest Percentage of Population Employed in Production in Paterson, NJ
RELATED REPORTS & OPTIONS
Production
Paterson
Compare Zip Codes
Map of Zip Codes with the Highest Percentage of Population Employed in Production in Paterson
8.2%
20.3%
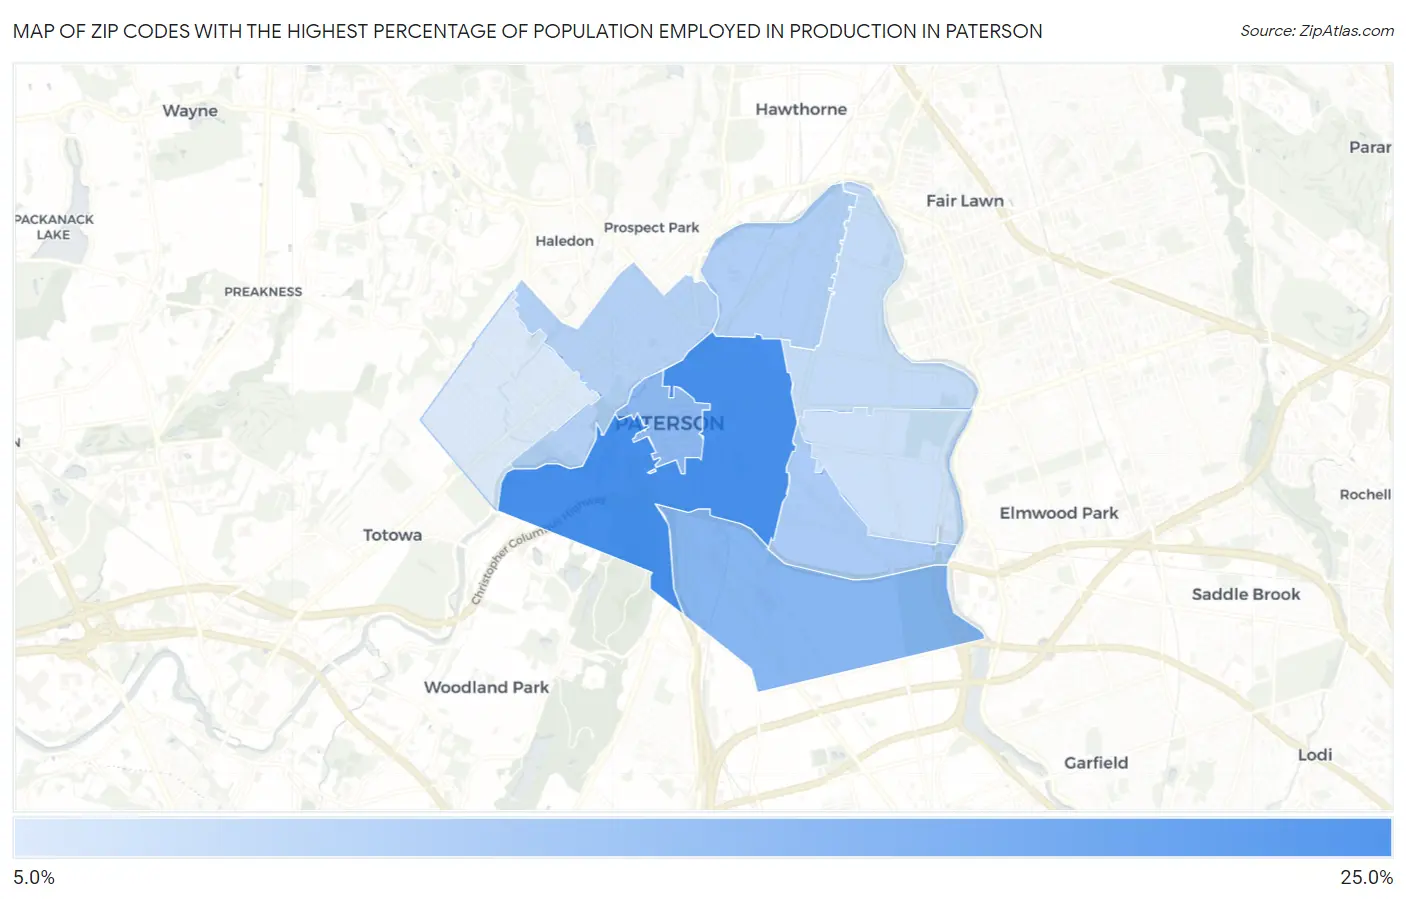
Zip Codes with the Highest Percentage of Population Employed in Production in Paterson, NJ
| Zip Code | % Employed | vs State | vs National | |
| 1. | 07501 | 20.3% | 3.8%(+16.5)#5 | 5.5%(+14.8)#1,324 |
| 2. | 07503 | 15.0% | 3.8%(+11.2)#8 | 5.5%(+9.53)#3,163 |
| 3. | 07505 | 14.5% | 3.8%(+10.7)#9 | 5.5%(+9.04)#3,447 |
| 4. | 07513 | 12.2% | 3.8%(+8.38)#14 | 5.5%(+6.72)#5,277 |
| 5. | 07524 | 11.6% | 3.8%(+7.75)#15 | 5.5%(+6.10)#5,894 |
| 6. | 07522 | 11.2% | 3.8%(+7.36)#17 | 5.5%(+5.70)#6,353 |
| 7. | 07514 | 10.1% | 3.8%(+6.32)#21 | 5.5%(+4.67)#7,640 |
| 8. | 07504 | 9.4% | 3.8%(+5.63)#28 | 5.5%(+3.97)#8,680 |
| 9. | 07502 | 8.2% | 3.8%(+4.41)#35 | 5.5%(+2.76)#10,639 |
1
Common Questions
What are the Top 5 Zip Codes with the Highest Percentage of Population Employed in Production in Paterson, NJ?
Top 5 Zip Codes with the Highest Percentage of Population Employed in Production in Paterson, NJ are:
What zip code has the Highest Percentage of Population Employed in Production in Paterson, NJ?
07501 has the Highest Percentage of Population Employed in Production in Paterson, NJ with 20.3%.
What is the Percentage of Population Employed in Production in Paterson, NJ?
Percentage of Population Employed in Production in Paterson is 13.2%.
What is the Percentage of Population Employed in Production in New Jersey?
Percentage of Population Employed in Production in New Jersey is 3.8%.
What is the Percentage of Population Employed in Production in the United States?
Percentage of Population Employed in Production in the United States is 5.5%.