Zip Codes with the Highest Percentage of Population Employed in Administrative & Support Services in Paterson, NJ
RELATED REPORTS & OPTIONS
Administrative & Support Services
Paterson
Compare Zip Codes
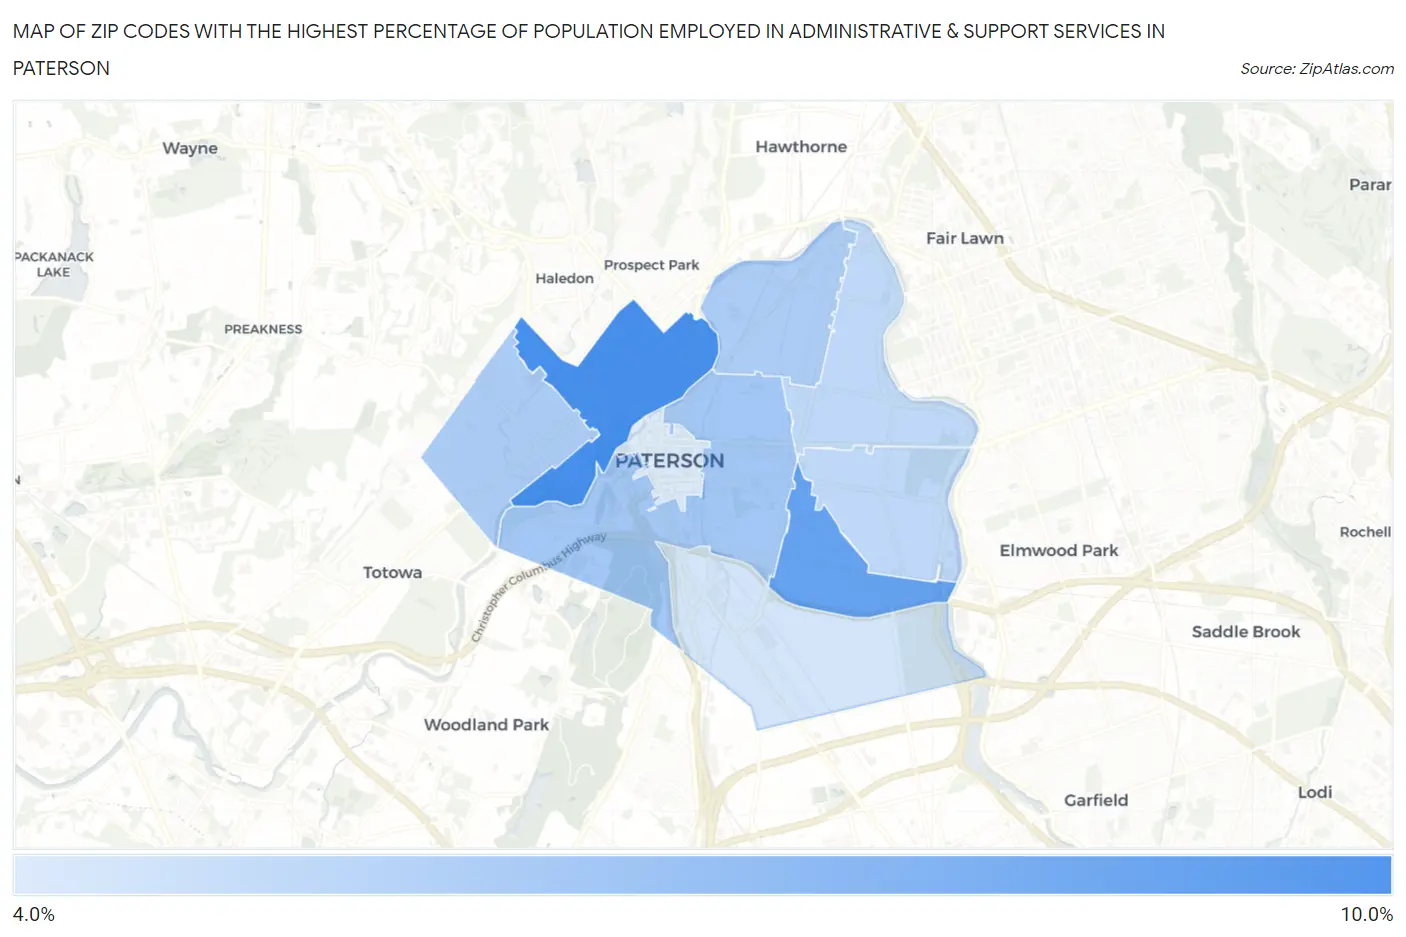
Map of Zip Codes with the Highest Percentage of Population Employed in Administrative & Support Services in Paterson
4.1%
9.0%
Zip Codes with the Highest Percentage of Population Employed in Administrative & Support Services in Paterson, NJ
| Zip Code | % Employed | vs State | vs National | |
| 1. | 07522 | 9.0% | 3.9%(+5.02)#18 | 4.1%(+4.82)#1,702 |
| 2. | 07513 | 7.9% | 3.9%(+3.99)#29 | 4.1%(+3.79)#2,324 |
| 3. | 07501 | 5.9% | 3.9%(+1.97)#69 | 4.1%(+1.77)#4,929 |
| 4. | 07502 | 5.7% | 3.9%(+1.71)#86 | 4.1%(+1.51)#5,452 |
| 5. | 07524 | 5.6% | 3.9%(+1.65)#89 | 4.1%(+1.45)#5,599 |
| 6. | 07514 | 5.0% | 3.9%(+1.07)#113 | 4.1%(+0.867)#7,059 |
| 7. | 07504 | 5.0% | 3.9%(+1.05)#117 | 4.1%(+0.845)#7,120 |
| 8. | 07503 | 4.3% | 3.9%(+0.373)#165 | 4.1%(+0.172)#9,368 |
| 9. | 07505 | 4.1% | 3.9%(+0.114)#183 | 4.1%(-0.087)#10,403 |
1
Common Questions
What are the Top 5 Zip Codes with the Highest Percentage of Population Employed in Administrative & Support Services in Paterson, NJ?
Top 5 Zip Codes with the Highest Percentage of Population Employed in Administrative & Support Services in Paterson, NJ are:
What zip code has the Highest Percentage of Population Employed in Administrative & Support Services in Paterson, NJ?
07522 has the Highest Percentage of Population Employed in Administrative & Support Services in Paterson, NJ with 9.0%.
What is the Percentage of Population Employed in Administrative & Support Services in Paterson, NJ?
Percentage of Population Employed in Administrative & Support Services in Paterson is 6.0%.
What is the Percentage of Population Employed in Administrative & Support Services in New Jersey?
Percentage of Population Employed in Administrative & Support Services in New Jersey is 3.9%.
What is the Percentage of Population Employed in Administrative & Support Services in the United States?
Percentage of Population Employed in Administrative & Support Services in the United States is 4.1%.