Zip Codes with the Highest Percentage of Immigrants from El Salvador in Independence, MO
RELATED REPORTS & OPTIONS
El Salvador
Independence
Compare Zip Codes
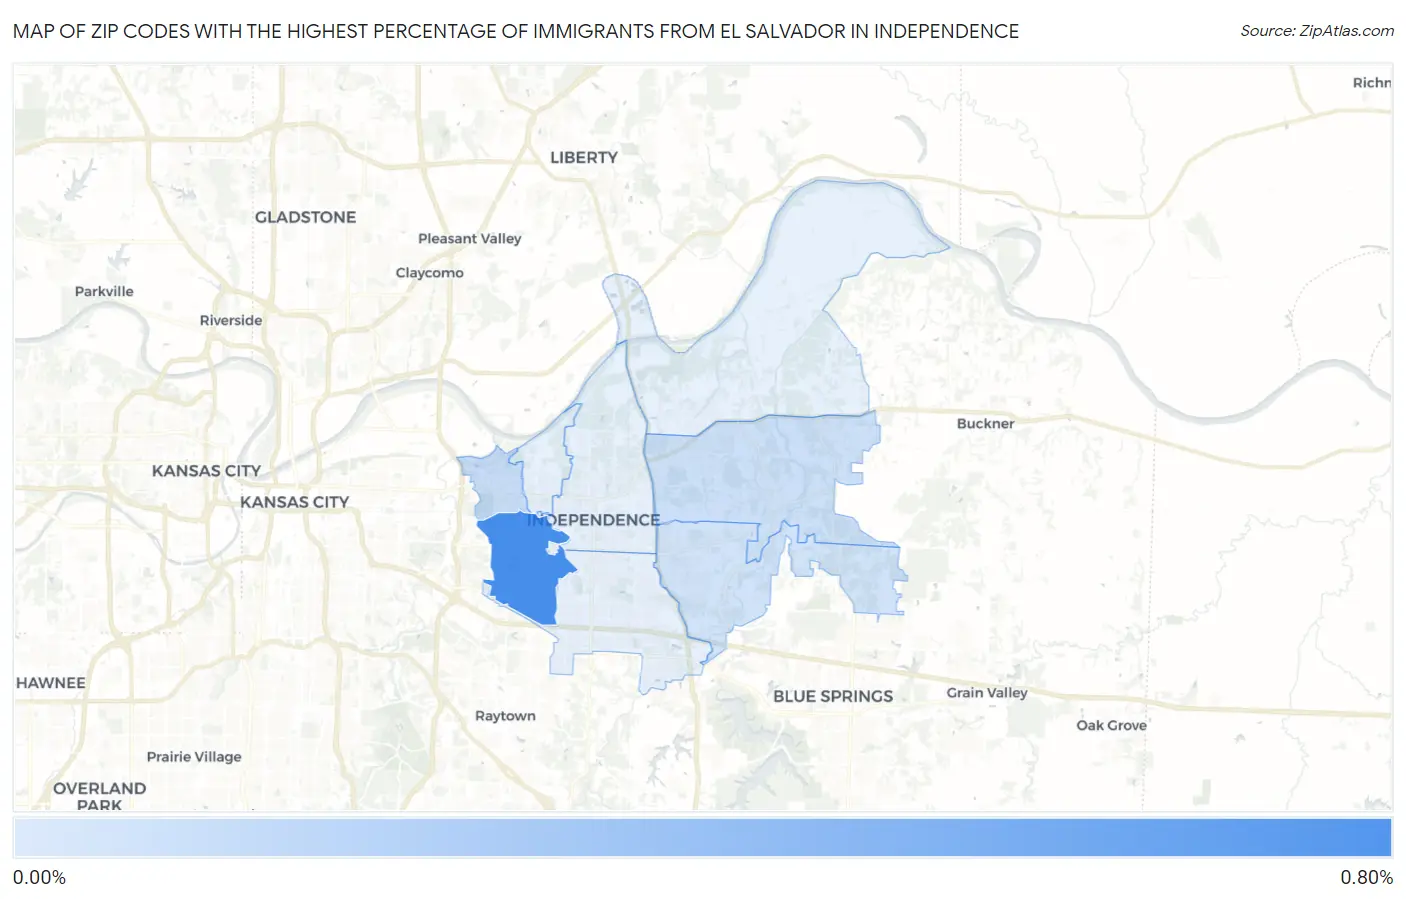
Map of Zip Codes with the Highest Percentage of Immigrants from El Salvador in Independence
0.063%
0.78%
Zip Codes with the Highest Percentage of Immigrants from El Salvador in Independence, MO
| Zip Code | El Salvador | vs State | vs National | |
| 1. | 64052 | 0.78% | 0.064%(+0.719)#-1 | 0.43%(+0.357)#0 |
| 2. | 64053 | 0.11% | 0.064%(+0.046)#0 | 0.43%(-0.316)#1 |
| 3. | 64056 | 0.083% | 0.064%(+0.019)#1 | 0.43%(-0.342)#2 |
| 4. | 64057 | 0.063% | 0.064%(-0.001)#2 | 0.43%(-0.362)#3 |
1
Common Questions
What are the Top 5 Zip Codes with the Highest Percentage of Immigrants from El Salvador in Independence, MO?
Top 5 Zip Codes with the Highest Percentage of Immigrants from El Salvador in Independence, MO are:
What zip code has the Highest Percentage of Immigrants from El Salvador in Independence, MO?
64052 has the Highest Percentage of Immigrants from El Salvador in Independence, MO with 0.78%.
What is the Percentage of Immigrants from El Salvador in Independence, MO?
Percentage of Immigrants from El Salvador in Independence is 0.17%.
What is the Percentage of Immigrants from El Salvador in Missouri?
Percentage of Immigrants from El Salvador in Missouri is 0.064%.
What is the Percentage of Immigrants from El Salvador in the United States?
Percentage of Immigrants from El Salvador in the United States is 0.43%.