Zip Codes with the Highest Percentage of Puerto Rican Population in Independence, MO
RELATED REPORTS & OPTIONS
Puerto Rican
Independence
Compare Zip Codes
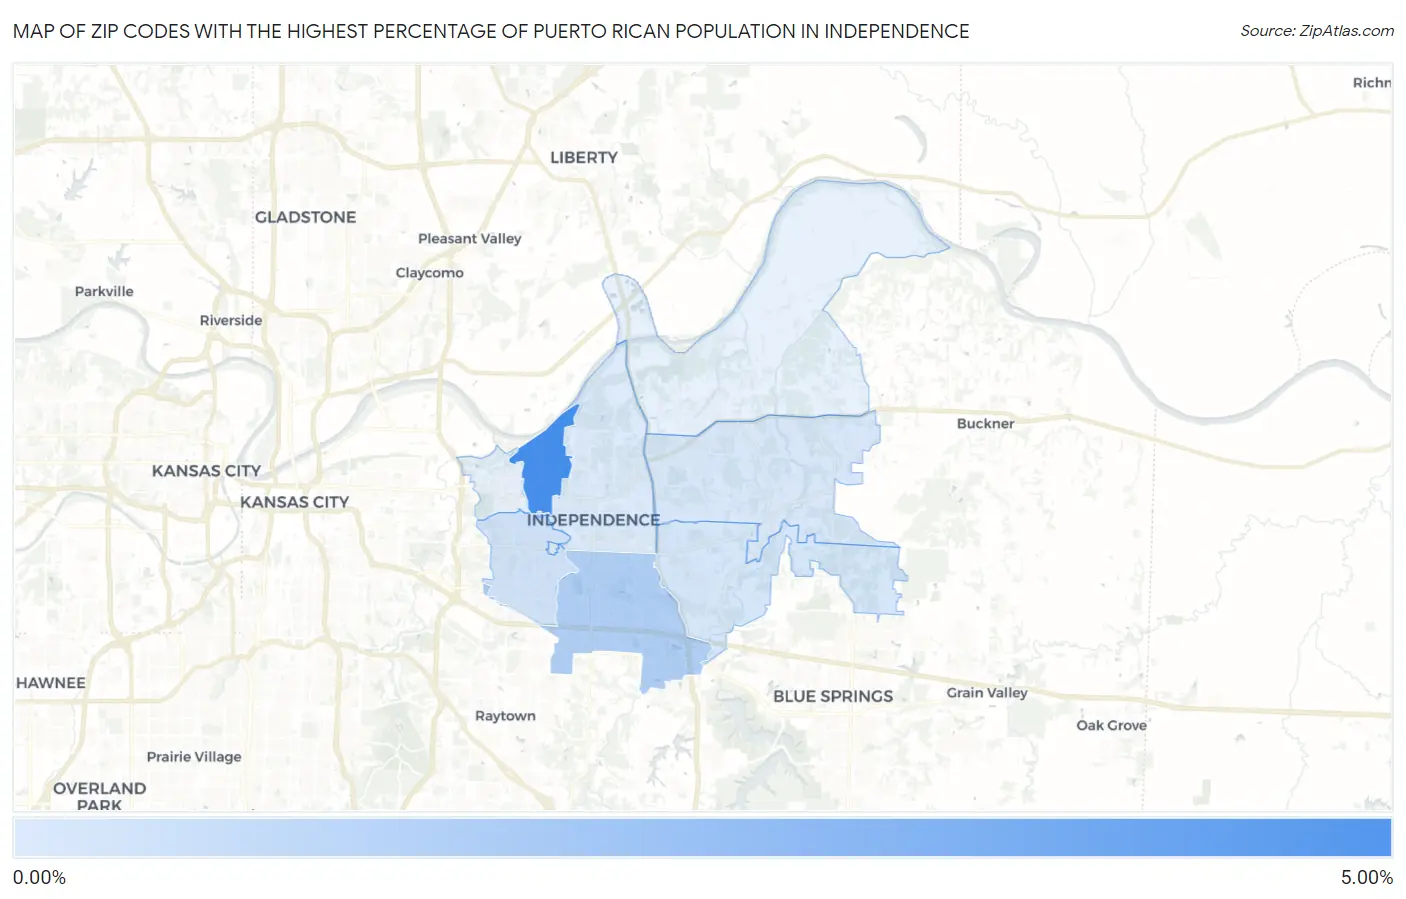
Map of Zip Codes with the Highest Percentage of Puerto Rican Population in Independence
0.13%
4.29%
Zip Codes with the Highest Percentage of Puerto Rican Population in Independence, MO
| Zip Code | Puerto Rican | vs State | vs National | |
| 1. | 64054 | 4.29% | 0.34%(+3.95)#9 | 1.78%(+2.51)#1,766 |
| 2. | 64055 | 1.35% | 0.34%(+1.01)#40 | 1.78%(-0.433)#5,301 |
| 3. | 64052 | 0.46% | 0.34%(+0.120)#105 | 1.78%(-1.32)#10,578 |
| 4. | 64057 | 0.29% | 0.34%(-0.051)#159 | 1.78%(-1.50)#12,592 |
| 5. | 64056 | 0.28% | 0.34%(-0.062)#164 | 1.78%(-1.51)#12,741 |
| 6. | 64050 | 0.13% | 0.34%(-0.211)#238 | 1.78%(-1.66)#14,889 |
1
Common Questions
What are the Top 5 Zip Codes with the Highest Percentage of Puerto Rican Population in Independence, MO?
Top 5 Zip Codes with the Highest Percentage of Puerto Rican Population in Independence, MO are:
What zip code has the Highest Percentage of Puerto Rican Population in Independence, MO?
64054 has the Highest Percentage of Puerto Rican Population in Independence, MO with 4.29%.
What is the Percentage of Puerto Rican Population in Independence, MO?
Percentage of Puerto Rican Population in Independence is 0.58%.
What is the Percentage of Puerto Rican Population in Missouri?
Percentage of Puerto Rican Population in Missouri is 0.34%.
What is the Percentage of Puerto Rican Population in the United States?
Percentage of Puerto Rican Population in the United States is 1.78%.