Zip Codes with the Highest Percentage of Hawaiian / Pacific Population in Independence, MO
RELATED REPORTS & OPTIONS
Hawaiian / Pacific
Independence
Compare Zip Codes
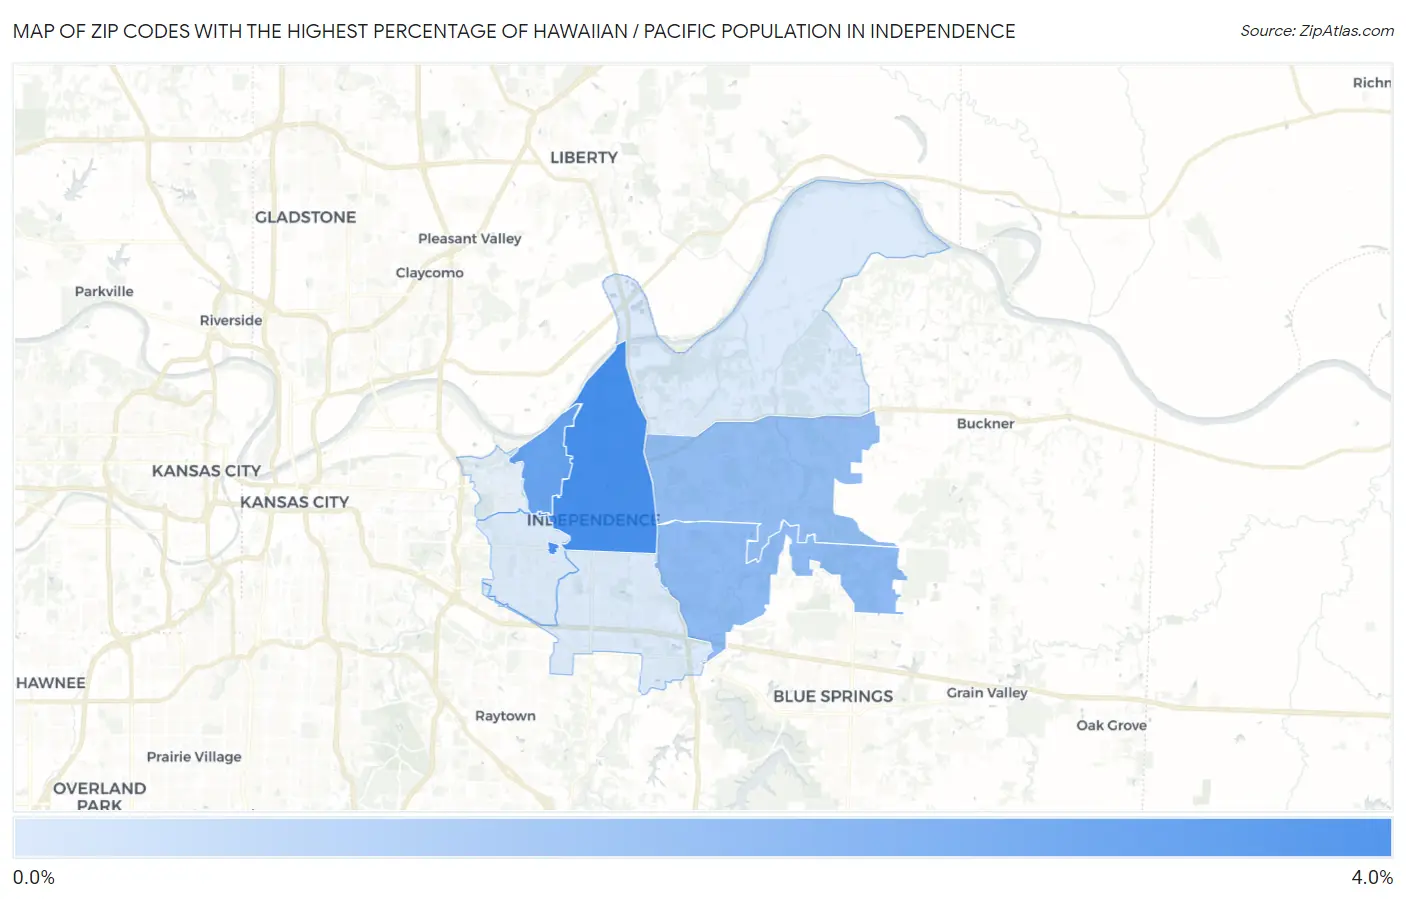
Map of Zip Codes with the Highest Percentage of Hawaiian / Pacific Population in Independence
0.12%
3.4%
Zip Codes with the Highest Percentage of Hawaiian / Pacific Population in Independence, MO
| Zip Code | Hawaiian / Pacific | vs State | vs National | |
| 1. | 64050 | 3.4% | 0.14%(+3.30)#8 | 0.19%(+3.25)#188 |
| 2. | 64054 | 2.7% | 0.14%(+2.53)#12 | 0.19%(+2.49)#245 |
| 3. | 64057 | 1.9% | 0.14%(+1.72)#20 | 0.19%(+1.67)#370 |
| 4. | 64056 | 1.8% | 0.14%(+1.62)#22 | 0.19%(+1.57)#389 |
| 5. | 64058 | 0.13% | 0.14%(-0.009)#107 | 0.19%(-0.054)#3,530 |
| 6. | 64052 | 0.12% | 0.14%(-0.027)#120 | 0.19%(-0.072)#3,773 |
| 7. | 64055 | 0.12% | 0.14%(-0.027)#121 | 0.19%(-0.073)#3,785 |
1
Common Questions
What are the Top 5 Zip Codes with the Highest Percentage of Hawaiian / Pacific Population in Independence, MO?
Top 5 Zip Codes with the Highest Percentage of Hawaiian / Pacific Population in Independence, MO are:
What zip code has the Highest Percentage of Hawaiian / Pacific Population in Independence, MO?
64050 has the Highest Percentage of Hawaiian / Pacific Population in Independence, MO with 3.4%.
What is the Percentage of Hawaiian / Pacific Population in Independence, MO?
Percentage of Hawaiian / Pacific Population in Independence is 1.1%.
What is the Percentage of Hawaiian / Pacific Population in Missouri?
Percentage of Hawaiian / Pacific Population in Missouri is 0.14%.
What is the Percentage of Hawaiian / Pacific Population in the United States?
Percentage of Hawaiian / Pacific Population in the United States is 0.19%.