Zip Codes with the Highest Percentage of Immigrants from Guatemala in Independence, MO
RELATED REPORTS & OPTIONS
Guatemala
Independence
Compare Zip Codes
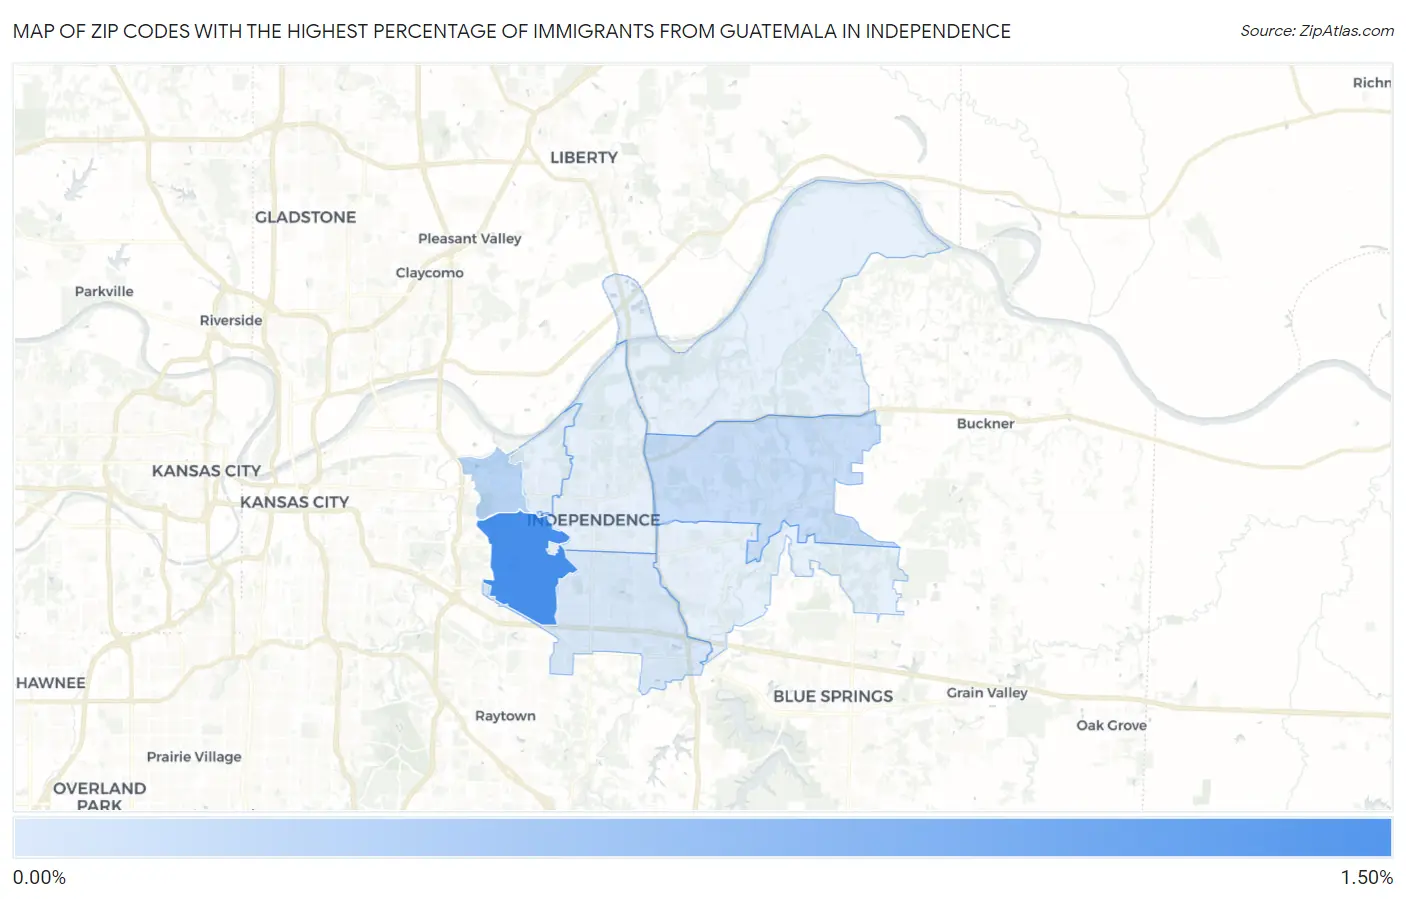
Map of Zip Codes with the Highest Percentage of Immigrants from Guatemala in Independence
0.030%
1.06%
Zip Codes with the Highest Percentage of Immigrants from Guatemala in Independence, MO
| Zip Code | Guatemala | vs State | vs National | |
| 1. | 64052 | 1.06% | 0.12%(+0.941)#-1 | 0.32%(+0.739)#0 |
| 2. | 64053 | 0.25% | 0.12%(+0.135)#0 | 0.32%(-0.067)#1 |
| 3. | 64056 | 0.15% | 0.12%(+0.033)#1 | 0.32%(-0.169)#2 |
| 4. | 64055 | 0.030% | 0.12%(-0.086)#27 | 0.32%(-0.287)#2,950 |
1
Common Questions
What are the Top 5 Zip Codes with the Highest Percentage of Immigrants from Guatemala in Independence, MO?
Top 5 Zip Codes with the Highest Percentage of Immigrants from Guatemala in Independence, MO are:
What zip code has the Highest Percentage of Immigrants from Guatemala in Independence, MO?
64052 has the Highest Percentage of Immigrants from Guatemala in Independence, MO with 1.06%.
What is the Percentage of Immigrants from Guatemala in Independence, MO?
Percentage of Immigrants from Guatemala in Independence is 0.24%.
What is the Percentage of Immigrants from Guatemala in Missouri?
Percentage of Immigrants from Guatemala in Missouri is 0.12%.
What is the Percentage of Immigrants from Guatemala in the United States?
Percentage of Immigrants from Guatemala in the United States is 0.32%.