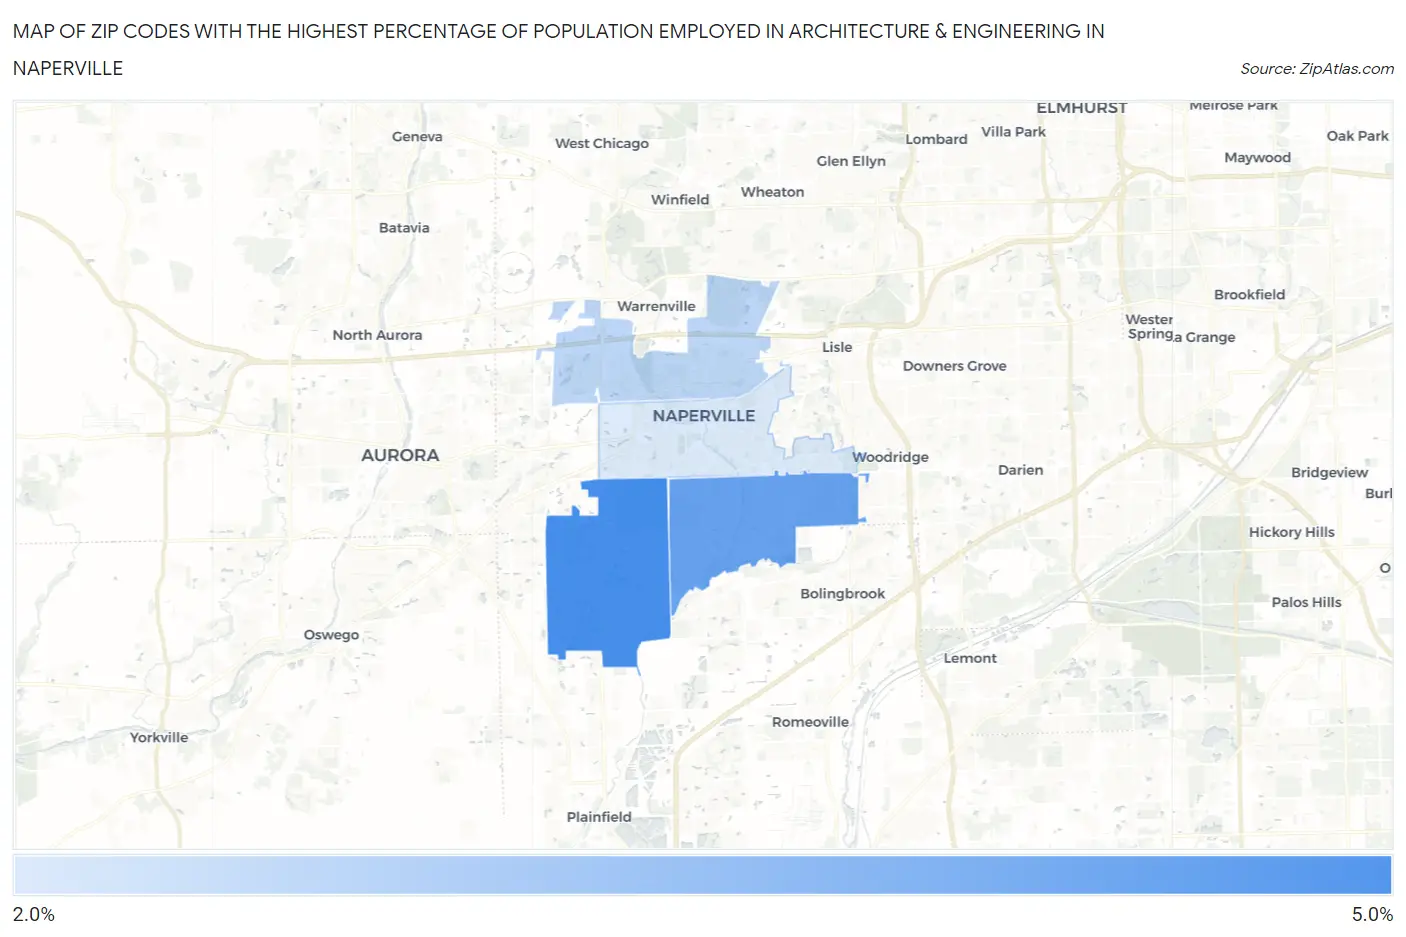
Zip Codes with the Highest Percentage of Population Employed in Architecture & Engineering in Naperville, IL
RELATED REPORTS & OPTIONS
Architecture & Engineering
Naperville
Compare Zip Codes
Map of Zip Codes with the Highest Percentage of Population Employed in Architecture & Engineering in Naperville
2.9%
4.7%
Zip Codes with the Highest Percentage of Population Employed in Architecture & Engineering in Naperville, IL
| Zip Code | % Employed | vs State | vs National | |
| 1. | 60564 | 4.7% | 1.9%(+2.83)#63 | 2.1%(+2.58)#1,900 |
| 2. | 60565 | 4.3% | 1.9%(+2.44)#76 | 2.1%(+2.18)#2,338 |
| 3. | 60563 | 3.2% | 1.9%(+1.35)#162 | 2.1%(+1.10)#4,337 |
| 4. | 60540 | 2.9% | 1.9%(+0.957)#211 | 2.1%(+0.702)#5,578 |
1
Common Questions
What are the Top 3 Zip Codes with the Highest Percentage of Population Employed in Architecture & Engineering in Naperville, IL?
Top 3 Zip Codes with the Highest Percentage of Population Employed in Architecture & Engineering in Naperville, IL are:
What zip code has the Highest Percentage of Population Employed in Architecture & Engineering in Naperville, IL?
60564 has the Highest Percentage of Population Employed in Architecture & Engineering in Naperville, IL with 4.7%.
What is the Percentage of Population Employed in Architecture & Engineering in Naperville, IL?
Percentage of Population Employed in Architecture & Engineering in Naperville is 4.0%.
What is the Percentage of Population Employed in Architecture & Engineering in Illinois?
Percentage of Population Employed in Architecture & Engineering in Illinois is 1.9%.
What is the Percentage of Population Employed in Architecture & Engineering in the United States?
Percentage of Population Employed in Architecture & Engineering in the United States is 2.1%.