Zip Codes with the Highest Percentage of Population with a Degree in Visual and Performing Arts in Naperville, IL
RELATED REPORTS & OPTIONS
Visual and Performing Arts
Naperville
Compare Zip Codes
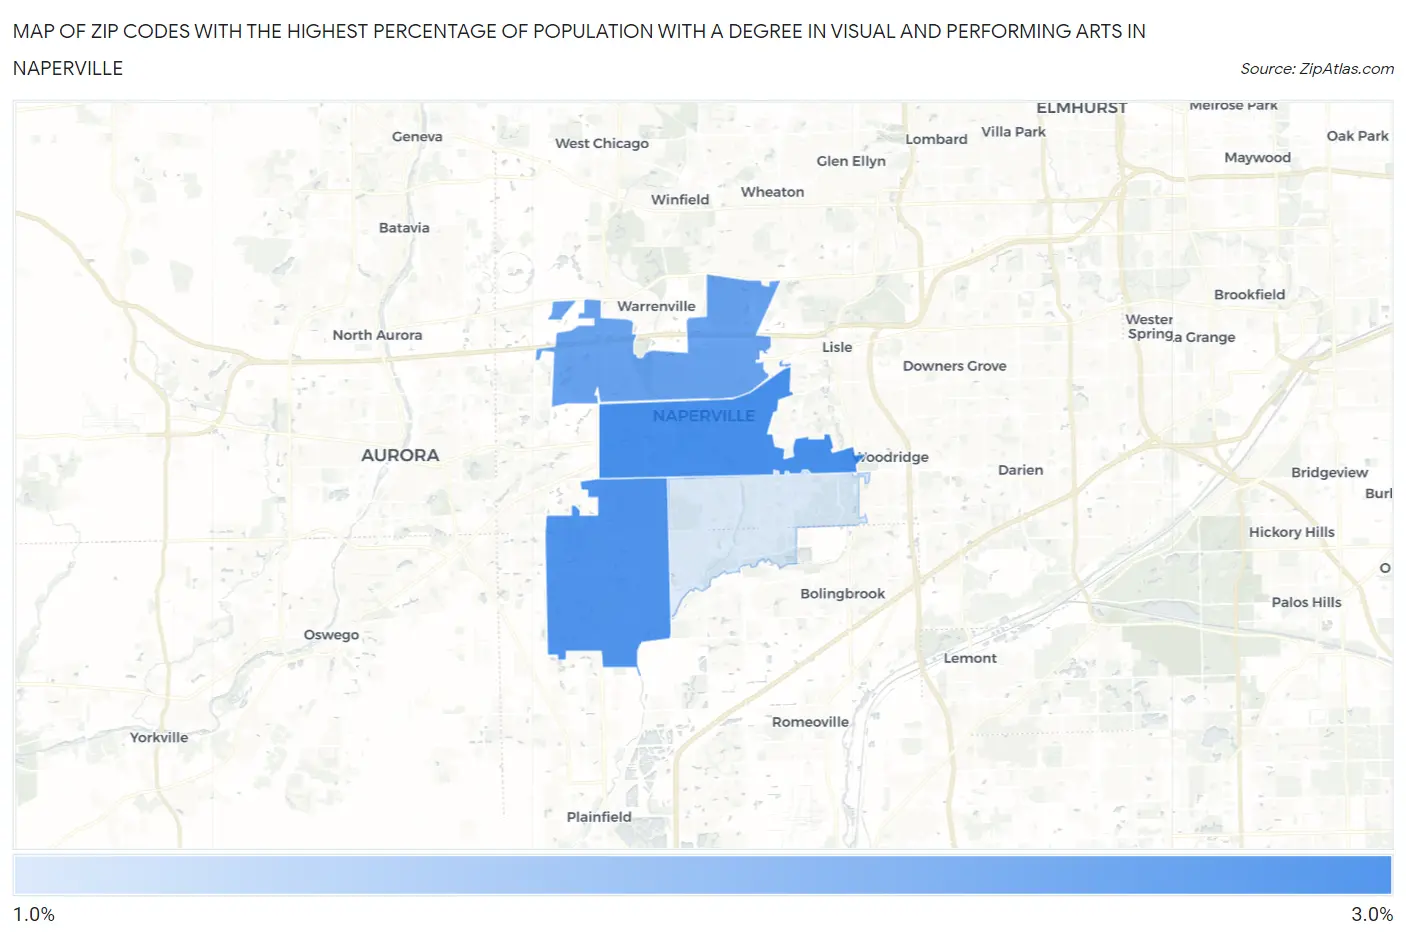
Map of Zip Codes with the Highest Percentage of Population with a Degree in Visual and Performing Arts in Naperville
1.8%
2.9%
Zip Codes with the Highest Percentage of Population with a Degree in Visual and Performing Arts in Naperville, IL
| Zip Code | % Graduates | vs State | vs National | |
| 1. | 60540 | 2.9% | 4.4%(-1.52)#531 | 4.3%(-1.32)#12,988 |
| 2. | 60564 | 2.9% | 4.4%(-1.60)#543 | 4.3%(-1.40)#13,292 |
| 3. | 60563 | 2.7% | 4.4%(-1.75)#569 | 4.3%(-1.56)#13,924 |
| 4. | 60565 | 1.8% | 4.4%(-2.61)#685 | 4.3%(-2.41)#17,003 |
1
Common Questions
What are the Top 3 Zip Codes with the Highest Percentage of Population with a Degree in Visual and Performing Arts in Naperville, IL?
Top 3 Zip Codes with the Highest Percentage of Population with a Degree in Visual and Performing Arts in Naperville, IL are:
What zip code has the Highest Percentage of Population with a Degree in Visual and Performing Arts in Naperville, IL?
60540 has the Highest Percentage of Population with a Degree in Visual and Performing Arts in Naperville, IL with 2.9%.
What is the Percentage of Population with a Degree in Visual and Performing Arts in Naperville, IL?
Percentage of Population with a Degree in Visual and Performing Arts in Naperville is 2.7%.
What is the Percentage of Population with a Degree in Visual and Performing Arts in Illinois?
Percentage of Population with a Degree in Visual and Performing Arts in Illinois is 4.4%.
What is the Percentage of Population with a Degree in Visual and Performing Arts in the United States?
Percentage of Population with a Degree in Visual and Performing Arts in the United States is 4.3%.