Zip Codes with the Highest Percentage of Population with a Degree in Visual and Performing Arts in Joliet, IL
RELATED REPORTS & OPTIONS
Visual and Performing Arts
Joliet
Compare Zip Codes
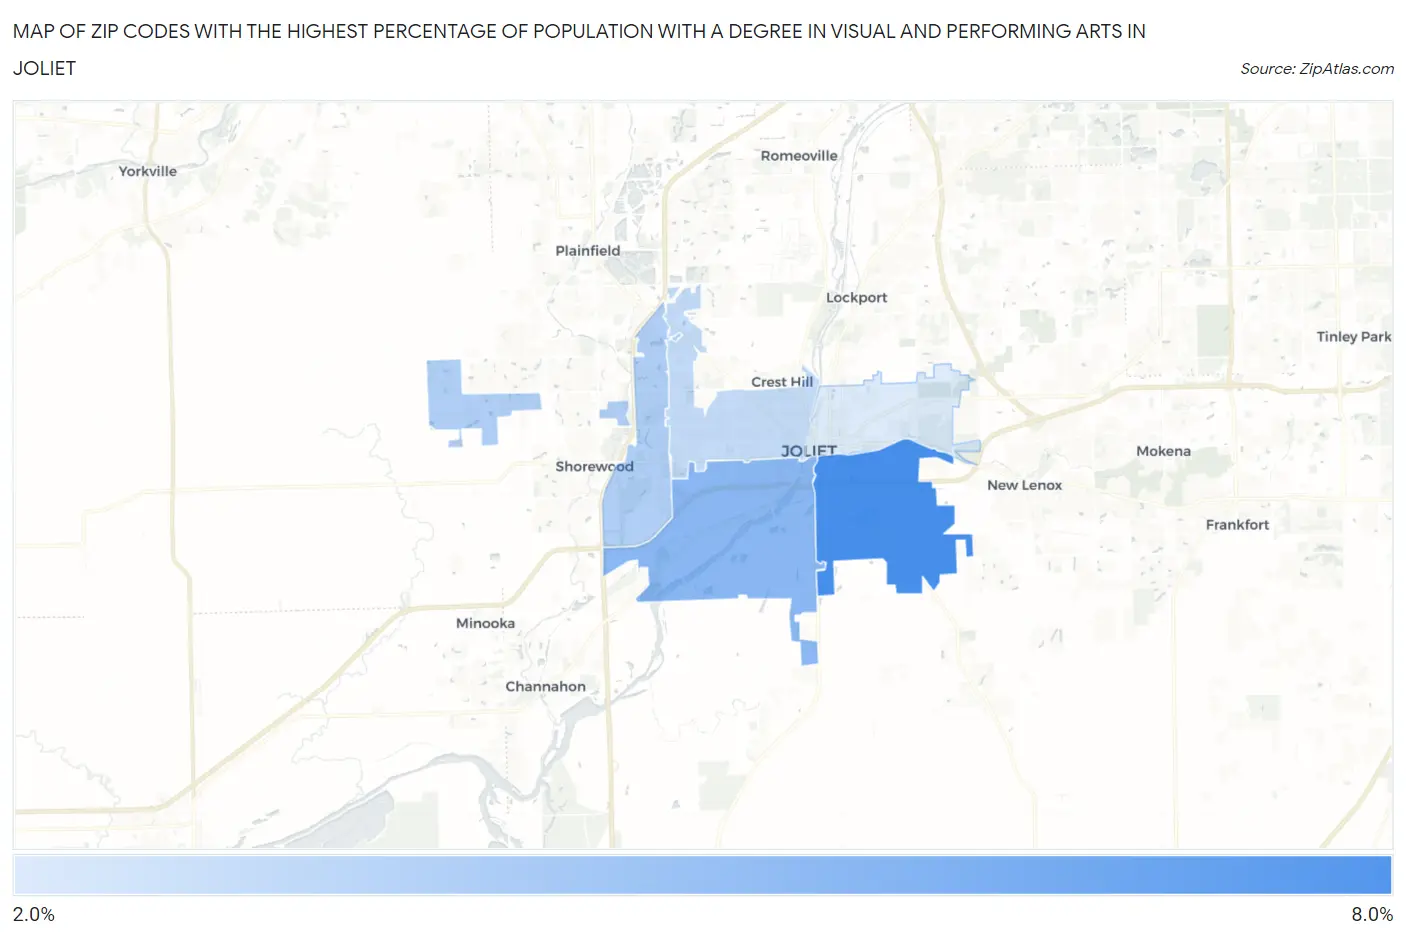
Map of Zip Codes with the Highest Percentage of Population with a Degree in Visual and Performing Arts in Joliet
2.2%
6.5%
Zip Codes with the Highest Percentage of Population with a Degree in Visual and Performing Arts in Joliet, IL
| Zip Code | % Graduates | vs State | vs National | |
| 1. | 60433 | 6.5% | 4.4%(+2.06)#170 | 4.3%(+2.26)#4,213 |
| 2. | 60436 | 4.5% | 4.4%(+0.096)#301 | 4.3%(+0.293)#7,672 |
| 3. | 60431 | 3.4% | 4.4%(-1.01)#445 | 4.3%(-0.814)#11,121 |
| 4. | 60435 | 2.9% | 4.4%(-1.56)#535 | 4.3%(-1.36)#13,146 |
| 5. | 60432 | 2.2% | 4.4%(-2.28)#646 | 4.3%(-2.08)#15,811 |
1
Common Questions
What are the Top 3 Zip Codes with the Highest Percentage of Population with a Degree in Visual and Performing Arts in Joliet, IL?
Top 3 Zip Codes with the Highest Percentage of Population with a Degree in Visual and Performing Arts in Joliet, IL are:
What zip code has the Highest Percentage of Population with a Degree in Visual and Performing Arts in Joliet, IL?
60433 has the Highest Percentage of Population with a Degree in Visual and Performing Arts in Joliet, IL with 6.5%.
What is the Percentage of Population with a Degree in Visual and Performing Arts in Joliet, IL?
Percentage of Population with a Degree in Visual and Performing Arts in Joliet is 2.9%.
What is the Percentage of Population with a Degree in Visual and Performing Arts in Illinois?
Percentage of Population with a Degree in Visual and Performing Arts in Illinois is 4.4%.
What is the Percentage of Population with a Degree in Visual and Performing Arts in the United States?
Percentage of Population with a Degree in Visual and Performing Arts in the United States is 4.3%.