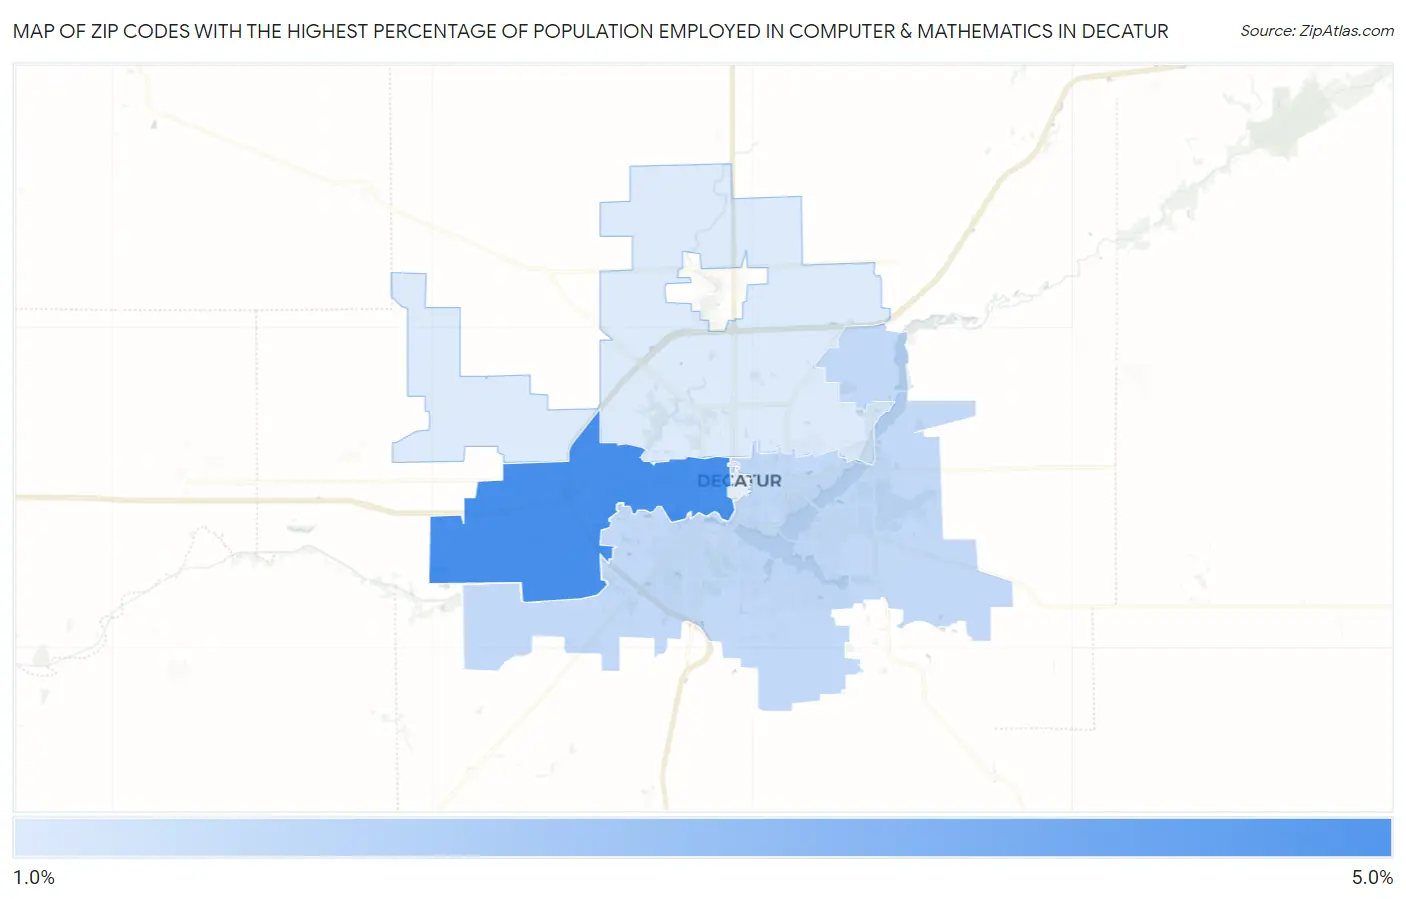
Zip Codes with the Highest Percentage of Population Employed in Computer & Mathematics in Decatur, IL
RELATED REPORTS & OPTIONS
Computer & Mathematics
Decatur
Compare Zip Codes
Map of Zip Codes with the Highest Percentage of Population Employed in Computer & Mathematics in Decatur
1.3%
4.0%
Zip Codes with the Highest Percentage of Population Employed in Computer & Mathematics in Decatur, IL
| Zip Code | % Employed | vs State | vs National | |
| 1. | 62522 | 4.0% | 3.6%(+0.438)#211 | 3.5%(+0.476)#5,038 |
| 2. | 62521 | 1.8% | 3.6%(-1.75)#511 | 3.5%(-1.71)#12,677 |
| 3. | 62526 | 1.3% | 3.6%(-2.23)#640 | 3.5%(-2.19)#15,313 |
1
Common Questions
What are the Top 3 Zip Codes with the Highest Percentage of Population Employed in Computer & Mathematics in Decatur, IL?
Top 3 Zip Codes with the Highest Percentage of Population Employed in Computer & Mathematics in Decatur, IL are:
What zip code has the Highest Percentage of Population Employed in Computer & Mathematics in Decatur, IL?
62522 has the Highest Percentage of Population Employed in Computer & Mathematics in Decatur, IL with 4.0%.
What is the Percentage of Population Employed in Computer & Mathematics in Decatur, IL?
Percentage of Population Employed in Computer & Mathematics in Decatur is 2.1%.
What is the Percentage of Population Employed in Computer & Mathematics in Illinois?
Percentage of Population Employed in Computer & Mathematics in Illinois is 3.6%.
What is the Percentage of Population Employed in Computer & Mathematics in the United States?
Percentage of Population Employed in Computer & Mathematics in the United States is 3.5%.