Zip Codes with the Highest Percentage of Population with a Degree in Visual and Performing Arts in Decatur, IL
RELATED REPORTS & OPTIONS
Visual and Performing Arts
Decatur
Compare Zip Codes
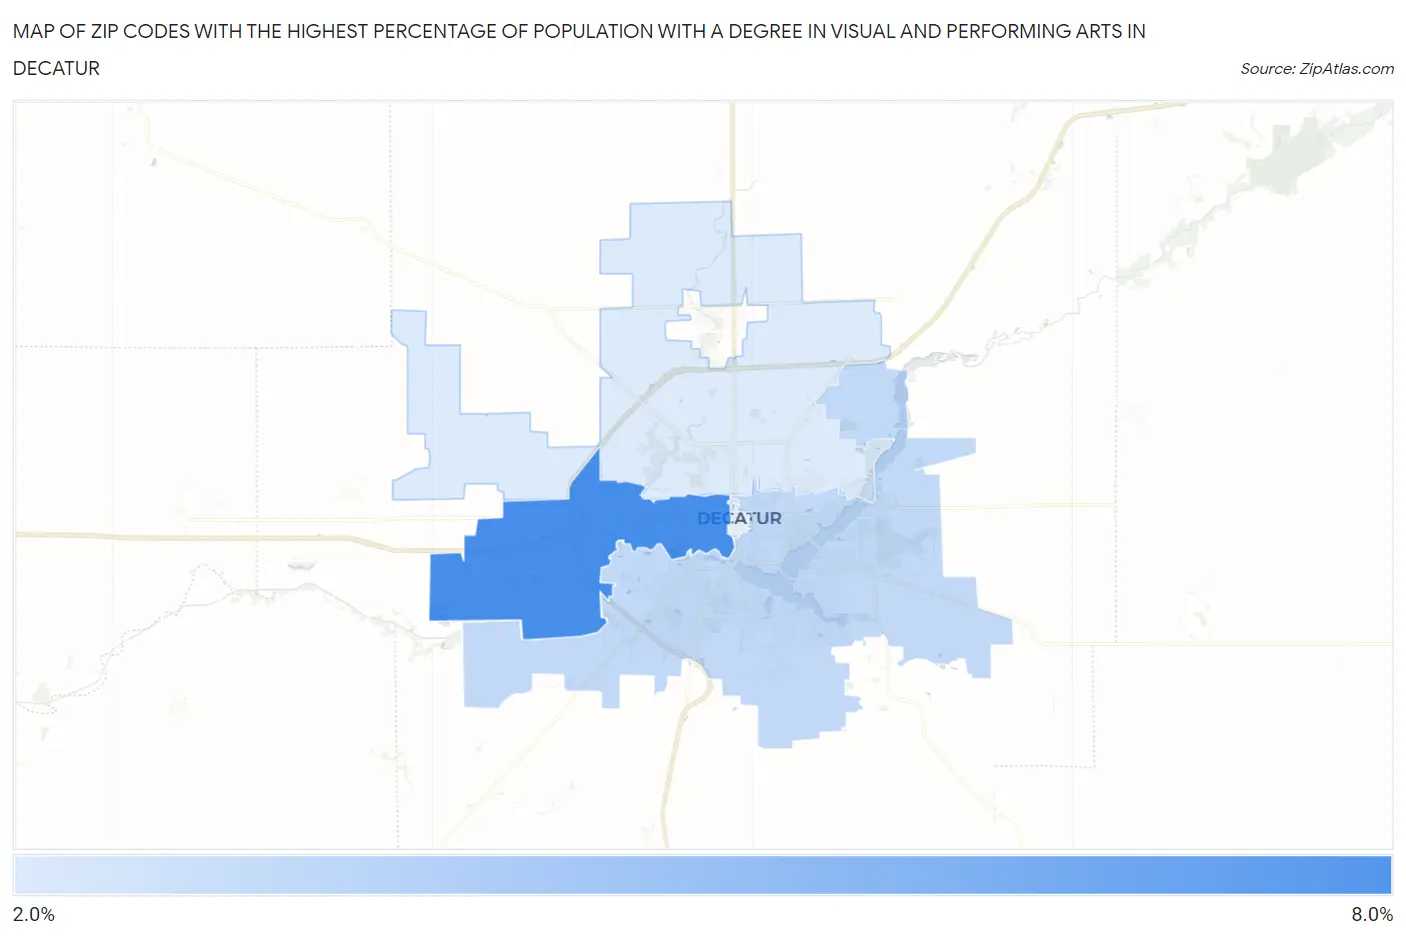
Map of Zip Codes with the Highest Percentage of Population with a Degree in Visual and Performing Arts in Decatur
2.4%
6.7%
Zip Codes with the Highest Percentage of Population with a Degree in Visual and Performing Arts in Decatur, IL
| Zip Code | % Graduates | vs State | vs National | |
| 1. | 62522 | 6.7% | 4.4%(+2.27)#155 | 4.3%(+2.47)#3,958 |
| 2. | 62521 | 3.1% | 4.4%(-1.32)#492 | 4.3%(-1.12)#12,215 |
| 3. | 62526 | 2.4% | 4.4%(-2.09)#620 | 4.3%(-1.89)#15,128 |
1
Common Questions
What are the Top 3 Zip Codes with the Highest Percentage of Population with a Degree in Visual and Performing Arts in Decatur, IL?
Top 3 Zip Codes with the Highest Percentage of Population with a Degree in Visual and Performing Arts in Decatur, IL are:
What zip code has the Highest Percentage of Population with a Degree in Visual and Performing Arts in Decatur, IL?
62522 has the Highest Percentage of Population with a Degree in Visual and Performing Arts in Decatur, IL with 6.7%.
What is the Percentage of Population with a Degree in Visual and Performing Arts in Decatur, IL?
Percentage of Population with a Degree in Visual and Performing Arts in Decatur is 4.0%.
What is the Percentage of Population with a Degree in Visual and Performing Arts in Illinois?
Percentage of Population with a Degree in Visual and Performing Arts in Illinois is 4.4%.
What is the Percentage of Population with a Degree in Visual and Performing Arts in the United States?
Percentage of Population with a Degree in Visual and Performing Arts in the United States is 4.3%.