Zip Codes with the Highest Percentage of Population with a Degree in Liberal Arts and History in West Des Moines, IA
RELATED REPORTS & OPTIONS
Liberal Arts and History
West Des Moines
Compare Zip Codes
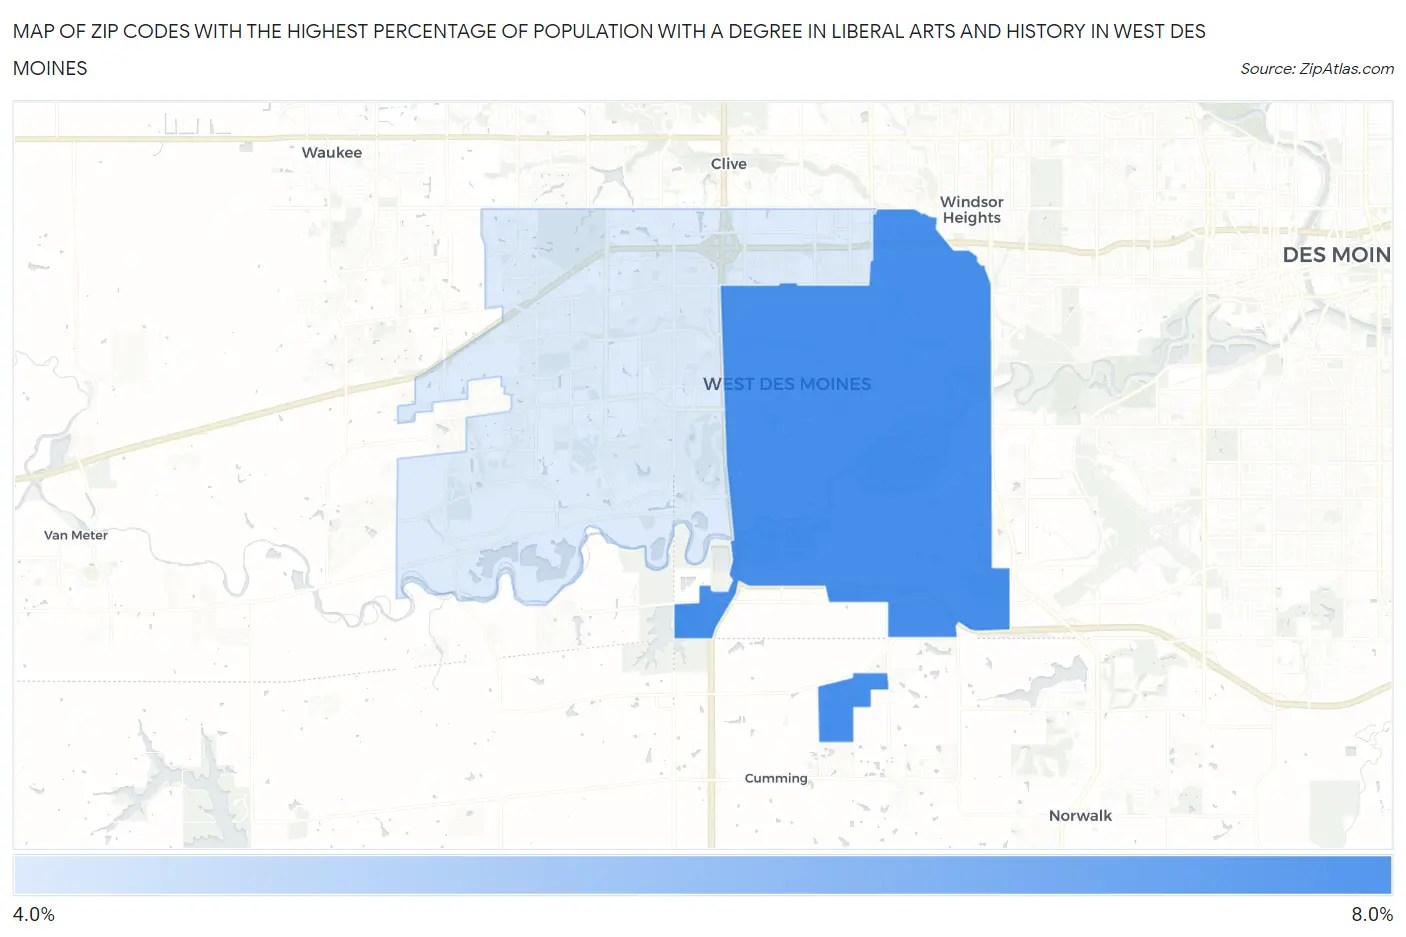
Map of Zip Codes with the Highest Percentage of Population with a Degree in Liberal Arts and History in West Des Moines
5.0%
7.9%
Zip Codes with the Highest Percentage of Population with a Degree in Liberal Arts and History in West Des Moines, IA
| Zip Code | % Graduates | vs State | vs National | |
| 1. | 50265 | 7.9% | 4.5%(+3.43)#133 | 4.9%(+3.07)#4,971 |
| 2. | 50266 | 5.0% | 4.5%(+0.462)#255 | 4.9%(+0.102)#11,420 |
1
Common Questions
What are the Top Zip Codes with the Highest Percentage of Population with a Degree in Liberal Arts and History in West Des Moines, IA?
Top Zip Codes with the Highest Percentage of Population with a Degree in Liberal Arts and History in West Des Moines, IA are:
What zip code has the Highest Percentage of Population with a Degree in Liberal Arts and History in West Des Moines, IA?
50265 has the Highest Percentage of Population with a Degree in Liberal Arts and History in West Des Moines, IA with 7.9%.
What is the Percentage of Population with a Degree in Liberal Arts and History in West Des Moines, IA?
Percentage of Population with a Degree in Liberal Arts and History in West Des Moines is 6.2%.
What is the Percentage of Population with a Degree in Liberal Arts and History in Iowa?
Percentage of Population with a Degree in Liberal Arts and History in Iowa is 4.5%.
What is the Percentage of Population with a Degree in Liberal Arts and History in the United States?
Percentage of Population with a Degree in Liberal Arts and History in the United States is 4.9%.