Zip Codes with the Highest Percentage of Population with a Degree in Liberal Arts and History in Dubuque, IA
RELATED REPORTS & OPTIONS
Liberal Arts and History
Dubuque
Compare Zip Codes
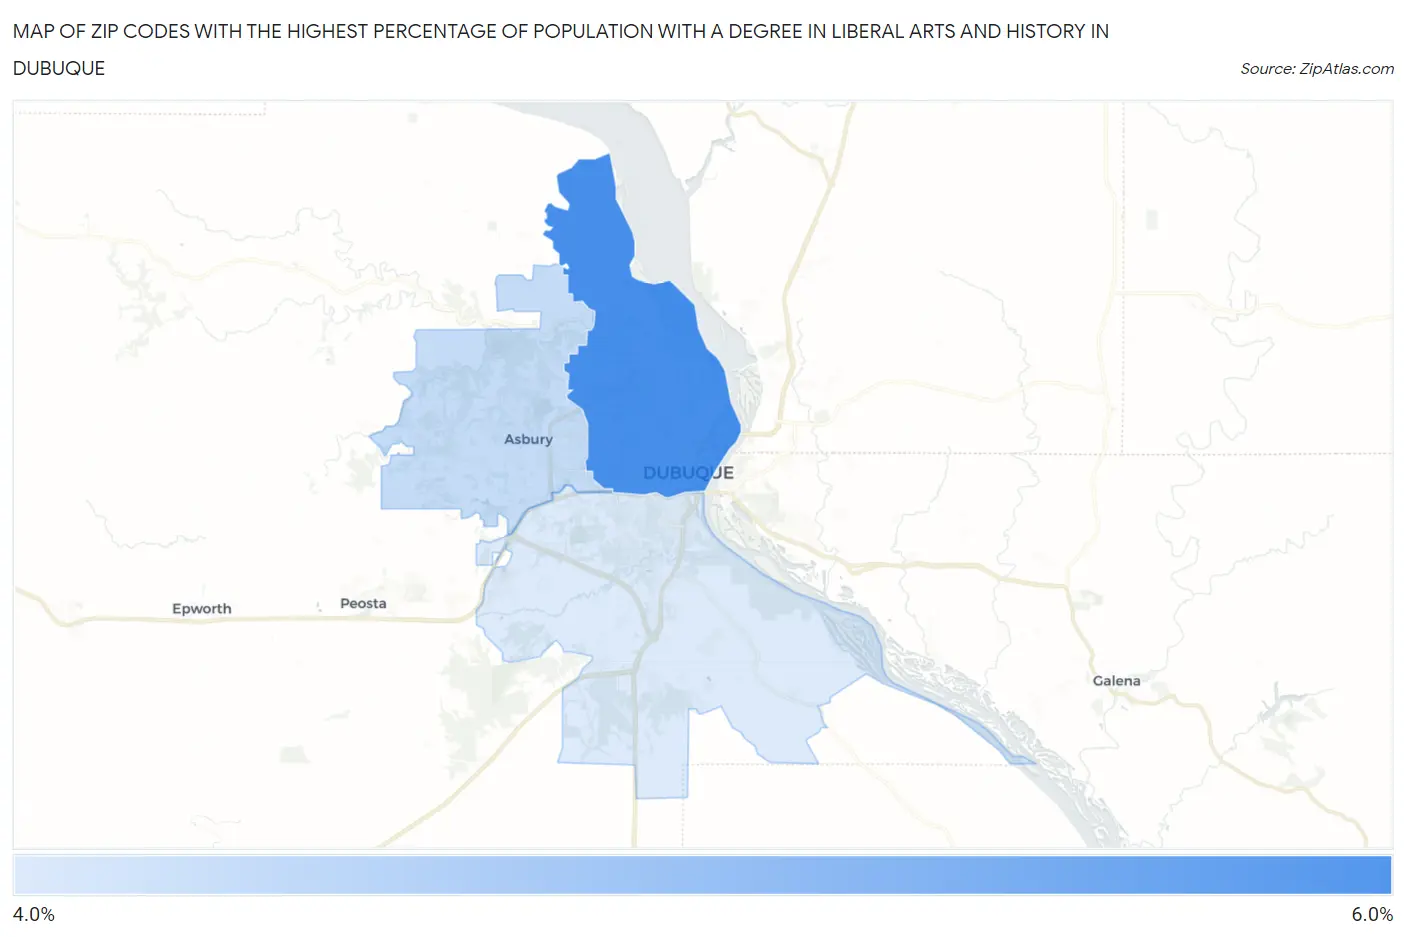
Map of Zip Codes with the Highest Percentage of Population with a Degree in Liberal Arts and History in Dubuque
4.4%
5.7%
Zip Codes with the Highest Percentage of Population with a Degree in Liberal Arts and History in Dubuque, IA
| Zip Code | % Graduates | vs State | vs National | |
| 1. | 52001 | 5.7% | 4.5%(+1.15)#226 | 4.9%(+0.794)#9,385 |
| 2. | 52002 | 4.6% | 4.5%(+0.120)#275 | 4.9%(-0.240)#12,544 |
| 3. | 52003 | 4.4% | 4.5%(-0.065)#292 | 4.9%(-0.424)#13,133 |
1
Common Questions
What are the Top Zip Codes with the Highest Percentage of Population with a Degree in Liberal Arts and History in Dubuque, IA?
Top Zip Codes with the Highest Percentage of Population with a Degree in Liberal Arts and History in Dubuque, IA are:
What zip code has the Highest Percentage of Population with a Degree in Liberal Arts and History in Dubuque, IA?
52001 has the Highest Percentage of Population with a Degree in Liberal Arts and History in Dubuque, IA with 5.7%.
What is the Percentage of Population with a Degree in Liberal Arts and History in Dubuque, IA?
Percentage of Population with a Degree in Liberal Arts and History in Dubuque is 6.2%.
What is the Percentage of Population with a Degree in Liberal Arts and History in Iowa?
Percentage of Population with a Degree in Liberal Arts and History in Iowa is 4.5%.
What is the Percentage of Population with a Degree in Liberal Arts and History in the United States?
Percentage of Population with a Degree in Liberal Arts and History in the United States is 4.9%.