Zip Codes with the Highest Percentage of Population with a Degree in Computers and Mathematics in Miami, FL

RELATED REPORTS & OPTIONS

Computers and Mathematics
Population
Families and Households
Female Fertility
Female Fertility (Unmarried)
Race (Community Size)
Race (Percentage)
Ancestry (Community Size)
AfghanAfricanAlbanianAmericanApacheArabArgentineanArmenianAustralianAustrianBahamianBarbadianBasqueBelgianBelizeanBermudanBhutaneseBlackfeetBolivianBrazilianBritishBritish West IndianBulgarianBurmeseCanadianCelticCentral AmericanCentral American IndianCherokeeChickasawChileanChippewaChoctawColombianComancheCosta RicanCreekCroatianCubanCypriotCzechCzechoslovakianDanishDominicanDutchDutch West IndianEastern EuropeanEcuadorianEgyptianEnglishEstonianEthiopianEuropeanFilipinoFinnishFrenchFrench American IndianFrench CanadianGermanGreekGuamanian / ChamorroGuatemalanGuyaneseHaitianHonduranHungarianIcelanderIndian (Asian)IndonesianInupiatIranianIraqiIrishIroquoisIsraeliItalianJamaicanJapaneseJordanianKenyanKoreanLaotianLatvianLebaneseLithuanianMacedonianMalaysianMalteseMexicanMexican American IndianMongolianMoroccanNative HawaiianNavajoNew ZealanderNicaraguanNigerianNorthern EuropeanNorwegianPakistaniPalestinianPanamanianParaguayanPennsylvania GermanPeruvianPolishPortuguesePuerto RicanRomanianRussianSalvadoranSamoanScandinavianScotch-IrishScottishSeminoleSenegaleseSerbianSiouxSlavicSlovakSloveneSouth AfricanSouth AmericanSouth American IndianSpaniardSpanishSpanish AmericanSpanish American IndianSri LankanSubsaharan AfricanSudaneseSwedishSwissSyrianThaiTrinidadian and TobagonianTurkishU.S. Virgin IslanderUkrainianUruguayanVenezuelanVietnameseWelshWest IndianYugoslavianZimbabwean
Ancestry (Percentage)
AfghanAfricanAlbanianAmericanApacheArabArgentineanArmenianAustralianAustrianBahamianBarbadianBasqueBelgianBelizeanBermudanBhutaneseBlackfeetBolivianBrazilianBritishBritish West IndianBulgarianBurmeseCanadianCelticCentral AmericanCentral American IndianCherokeeChickasawChileanChippewaChoctawColombianComancheCosta RicanCreekCroatianCubanCypriotCzechCzechoslovakianDanishDominicanDutchDutch West IndianEastern EuropeanEcuadorianEgyptianEnglishEstonianEthiopianEuropeanFilipinoFinnishFrenchFrench American IndianFrench CanadianGermanGreekGuamanian / ChamorroGuatemalanGuyaneseHaitianHonduranHungarianIcelanderIndian (Asian)IndonesianInupiatIranianIraqiIrishIroquoisIsraeliItalianJamaicanJapaneseJordanianKenyanKoreanLaotianLatvianLebaneseLithuanianMacedonianMalaysianMalteseMexicanMexican American IndianMongolianMoroccanNative HawaiianNavajoNew ZealanderNicaraguanNigerianNorthern EuropeanNorwegianPakistaniPalestinianPanamanianParaguayanPennsylvania GermanPeruvianPolishPortuguesePuerto RicanRomanianRussianSalvadoranSamoanScandinavianScotch-IrishScottishSeminoleSenegaleseSerbianSiouxSlavicSlovakSloveneSouth AfricanSouth AmericanSouth American IndianSpaniardSpanishSpanish AmericanSpanish American IndianSri LankanSubsaharan AfricanSudaneseSwedishSwissSyrianThaiTrinidadian and TobagonianTurkishU.S. Virgin IslanderUkrainianUruguayanVenezuelanVietnameseWelshWest IndianYugoslavianZimbabwean
Immigrant Origin (Total)
AfghanistanAfricaAlbaniaArgentinaArmeniaAsiaAustraliaAustriaBahamasBangladeshBarbadosBelarusBelgiumBelizeBoliviaBosnia and HerzegovinaBrazilBulgariaBurma / MyanmarCambodiaCameroonCanadaCaribbeanCentral AmericaChileChinaColombiaCosta RicaCroatiaCubaCzechoslovakiaDenmarkDominicaDominican RepublicEastern AfricaEastern AsiaEastern EuropeEcuadorEgyptEl SalvadorEnglandEthiopiaEuropeFranceGermanyGreeceGrenadaGuatemalaGuyanaHaitiHondurasHong KongHungaryIndiaIndonesiaIranIraqIrelandIsraelItalyJamaicaJapanJordanKazakhstanKenyaKoreaKuwaitLaosLatin AmericaLatviaLebanonLithuaniaMalaysiaMexicoMiddle AfricaMoldovaMoroccoNepalNetherlandsNicaraguaNigeriaNorthern AfricaNorthern EuropeNorwayOceaniaPakistanPanamaPeruPhilippinesPolandPortugalRomaniaRussiaSaudi ArabiaScotlandSerbiaSingaporeSouth AfricaSouth AmericaSouth Central AsiaSouth Eastern AsiaSouthern EuropeSpainSri LankaSt. Vincent and the GrenadinesSudanSwedenSwitzerlandSyriaTaiwanThailandTrinidad and TobagoTurkeyUgandaUkraineUruguayUzbekistanVenezuelaVietnamWest IndiesWestern AfricaWestern AsiaWestern EuropeZaireZimbabwe
Immigrant Origin (Percentage)
AfghanistanAfricaAlbaniaArgentinaArmeniaAsiaAustraliaAustriaBahamasBangladeshBarbadosBelarusBelgiumBelizeBoliviaBosnia and HerzegovinaBrazilBulgariaBurma / MyanmarCambodiaCameroonCanadaCaribbeanCentral AmericaChileChinaColombiaCosta RicaCroatiaCubaCzechoslovakiaDenmarkDominicaDominican RepublicEastern AfricaEastern AsiaEastern EuropeEcuadorEgyptEl SalvadorEnglandEthiopiaEuropeFranceGermanyGreeceGrenadaGuatemalaGuyanaHaitiHondurasHong KongHungaryIndiaIndonesiaIranIraqIrelandIsraelItalyJamaicaJapanJordanKazakhstanKenyaKoreaKuwaitLaosLatin AmericaLatviaLebanonLithuaniaMalaysiaMexicoMiddle AfricaMoldovaMoroccoNepalNetherlandsNicaraguaNigeriaNorthern AfricaNorthern EuropeNorwayOceaniaPakistanPanamaPeruPhilippinesPolandPortugalRomaniaRussiaSaudi ArabiaScotlandSerbiaSingaporeSouth AfricaSouth AmericaSouth Central AsiaSouth Eastern AsiaSouthern EuropeSpainSri LankaSt. Vincent and the GrenadinesSudanSwedenSwitzerlandSyriaTaiwanThailandTrinidad and TobagoTurkeyUgandaUkraineUruguayUzbekistanVenezuelaVietnamWest IndiesWestern AfricaWestern AsiaWestern EuropeZaireZimbabwe
Income
Income (Families)
Income (Households)
Poverty
Poverty (Families)
Unemployment
Employment Occupations
Employment Industries
Employer Class
Commute Time
Commute Means
School Enrollment
Education by Degree Field
Occupancy
Finances
Physical Characteristics
Miami
States
Florida Cities
Altamonte SpringsApopkaArcadiaBoca RatonBonita SpringsBoynton BeachBradentonBrandonBrooksvilleCape CoralCasselberryClearwaterClermontCocoaCoral SpringsCrestviewCrystal RiverDade CityDavenportDaytona BeachDeerfield BeachDefuniak SpringsDelandDelray BeachDeltonaDunnellonEdgewaterEnglewoodEustisFort LauderdaleFort MyersFort PierceFort Walton BeachGainesvilleGulf BreezeHialeahHolidayHollywoodHomesteadHomosassaHudsonInvernessJacksonvilleJupiterKissimmeeLake CityLake WalesLake WorthLakelandLand O LakesLargoLeesburgLehigh AcresLive OakLongwoodLutzMelbourneMerritt IslandMiamiMiami BeachMiltonNaplesNew Port RicheyNew Smyrna BeachNorth Fort MyersNorth PortOcalaOkeechobeeOpa LockaOrange ParkOrlandoOrmond BeachOviedoPalm BayPalm Beach GardensPalm CoastPalm HarborPanama CityPanama City BeachPensacolaPinellas ParkPlant CityPompano BeachPort CharlottePort OrangePort Saint LuciePunta GordaQuincyRiverviewSaint AugustineSaint CloudSaint PetersburgSanfordSarasotaSebastianSebringSeminoleSpring HillStuartTallahasseeTampaTarpon SpringsThe VillagesTitusvilleValricoVeniceVero BeachWesley ChapelWest Palm BeachWinter HavenWinter ParkZephyrhills
Compare Zip Codes
Comparison Subject

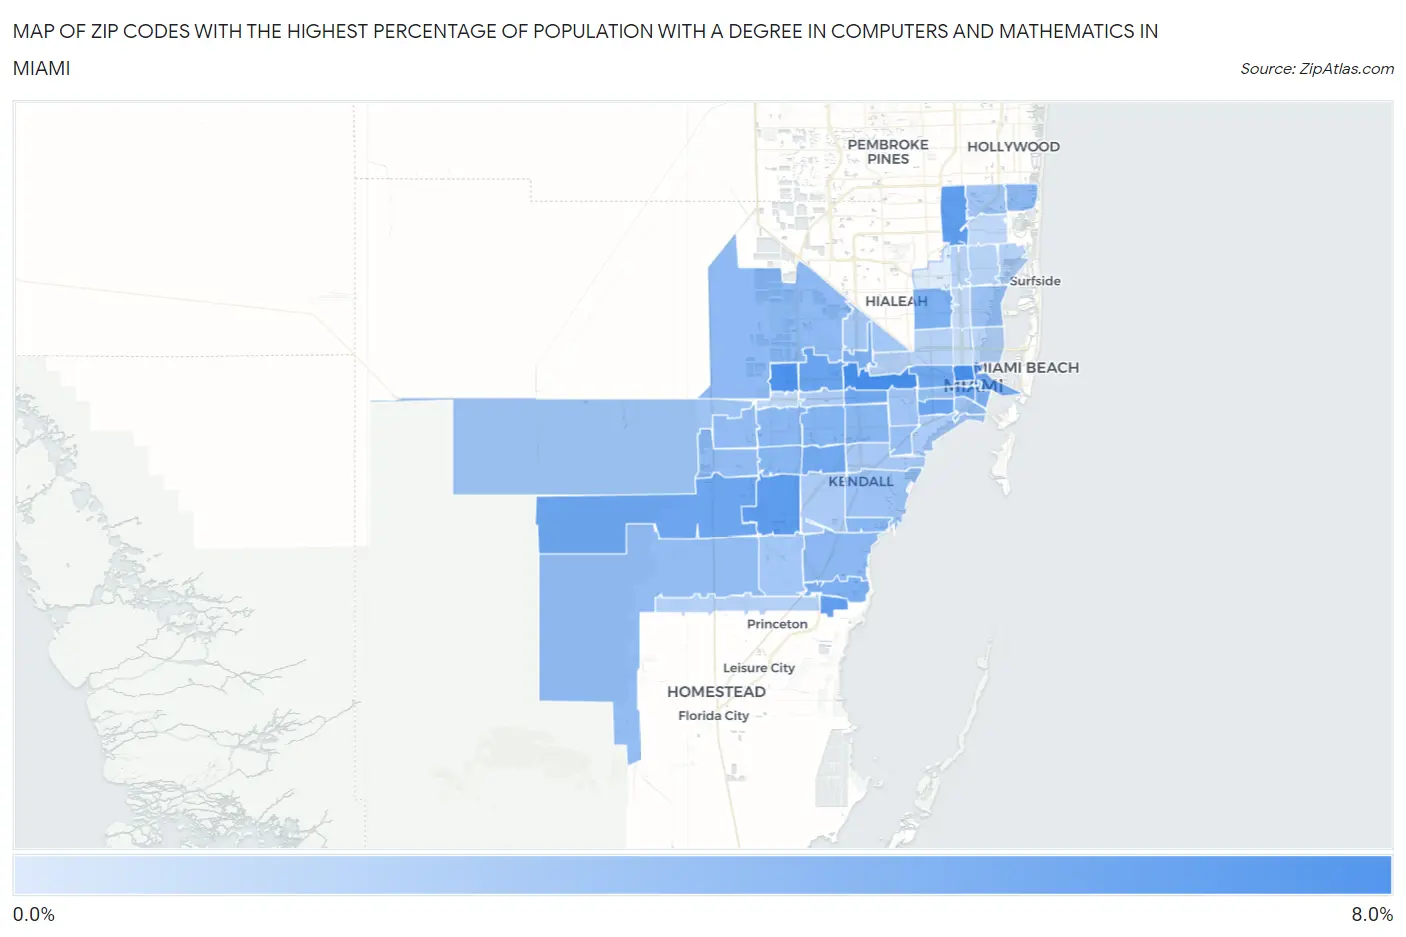
Map of Zip Codes with the Highest Percentage of Population with a Degree in Computers and Mathematics in Miami

0.0%
8.0%
Zip Codes with the Highest Percentage of Population with a Degree in Computers and Mathematics in Miami Map

Zip Codes with the Highest Percentage of Population with a Degree in Computers and Mathematics in Miami, FL

Zip Code % Graduates vs State vs National
1.331366.3%4.1%(+2.15)#1104.9%(+1.39)#4,802
2.331266.3%4.1%(+2.12)#1134.9%(+1.36)#4,843
3.331826.0%4.1%(+1.88)#1304.9%(+1.11)#5,286
4.331865.4%4.1%(+1.23)#1914.9%(+0.466)#6,610
5.331695.3%4.1%(+1.17)#1964.9%(+0.402)#6,763
6.331905.2%4.1%(+1.09)#2044.9%(+0.331)#6,934
7.331724.9%4.1%(+0.807)#2364.9%(+0.044)#7,599
8.331454.8%4.1%(+0.669)#2564.9%(-0.095)#7,990
9.331964.7%4.1%(+0.617)#2624.9%(-0.146)#8,133
10.331444.7%4.1%(+0.555)#2674.9%(-0.208)#8,312
11.331254.7%4.1%(+0.546)#2684.9%(-0.218)#8,346
12.331304.6%4.1%(+0.516)#2764.9%(-0.248)#8,444
13.331734.6%4.1%(+0.515)#2784.9%(-0.248)#8,447
14.331324.4%4.1%(+0.260)#3184.9%(-0.504)#9,231
15.331894.2%4.1%(+0.069)#3484.9%(-0.695)#9,844
16.331224.2%4.1%(+0.053)#3524.9%(-0.710)#9,892
17.331474.1%4.1%(-0.012)#3574.9%(-0.775)#10,079
18.331654.0%4.1%(-0.154)#3744.9%(-0.917)#10,534
19.331553.8%4.1%(-0.336)#4134.9%(-1.10)#11,207
20.331583.8%4.1%(-0.354)#4154.9%(-1.12)#11,274
21.331313.8%4.1%(-0.378)#4204.9%(-1.14)#11,364
22.331833.7%4.1%(-0.391)#4254.9%(-1.15)#11,396
23.331753.7%4.1%(-0.425)#4414.9%(-1.19)#11,510
24.331573.6%4.1%(-0.506)#4654.9%(-1.27)#11,796
25.331803.6%4.1%(-0.537)#4754.9%(-1.30)#11,916
26.331783.5%4.1%(-0.666)#5014.9%(-1.43)#12,427
27.331933.4%4.1%(-0.699)#5064.9%(-1.46)#12,555
28.331853.4%4.1%(-0.725)#5144.9%(-1.49)#12,648
29.331873.4%4.1%(-0.777)#5274.9%(-1.54)#12,814
30.331353.2%4.1%(-0.925)#5504.9%(-1.69)#13,369
31.331463.2%4.1%(-0.953)#5554.9%(-1.72)#13,464
32.331383.1%4.1%(-1.05)#5734.9%(-1.82)#13,801
33.331563.0%4.1%(-1.10)#5794.9%(-1.86)#13,980
34.331293.0%4.1%(-1.14)#5904.9%(-1.91)#14,133
35.331942.9%4.1%(-1.27)#6084.9%(-2.03)#14,563
36.331342.8%4.1%(-1.32)#6154.9%(-2.08)#14,739
37.331792.8%4.1%(-1.35)#6204.9%(-2.11)#14,854
38.331772.7%4.1%(-1.41)#6314.9%(-2.17)#15,082
39.331662.7%4.1%(-1.42)#6334.9%(-2.18)#15,120
40.331432.6%4.1%(-1.50)#6474.9%(-2.27)#15,429
41.331762.5%4.1%(-1.66)#6794.9%(-2.42)#16,010
42.331332.5%4.1%(-1.67)#6844.9%(-2.44)#16,070
43.331742.3%4.1%(-1.80)#7024.9%(-2.56)#16,473
44.331702.1%4.1%(-2.01)#7284.9%(-2.77)#17,228
45.331282.1%4.1%(-2.02)#7314.9%(-2.79)#17,271
46.331682.0%4.1%(-2.10)#7394.9%(-2.86)#17,512
47.331612.0%4.1%(-2.11)#7404.9%(-2.87)#17,555
48.331422.0%4.1%(-2.12)#7434.9%(-2.89)#17,610
49.331812.0%4.1%(-2.16)#7514.9%(-2.92)#17,720
50.331371.9%4.1%(-2.19)#7564.9%(-2.95)#17,822
51.331841.8%4.1%(-2.38)#7734.9%(-3.14)#18,363
52.331621.6%4.1%(-2.49)#7874.9%(-3.25)#18,721
53.331501.5%4.1%(-2.61)#7974.9%(-3.38)#19,096
54.331271.3%4.1%(-2.78)#8114.9%(-3.54)#19,564
55.331670.52%4.1%(-3.61)#8504.9%(-4.38)#21,456

Common Questions

What are the Top 10 Zip Codes with the Highest Percentage of Population with a Degree in Computers and Mathematics in Miami, FL?
Top 10 Zip Codes with the Highest Percentage of Population with a Degree in Computers and Mathematics in Miami, FL are:
#1
6.3%
#2
6.3%
#3
6.0%
#4
5.4%
#5
5.3%
#6
5.2%
#7
4.9%
#8
4.8%
#9
4.7%
#10
4.7%
What zip code has the Highest Percentage of Population with a Degree in Computers and Mathematics in Miami, FL?
33136 has the Highest Percentage of Population with a Degree in Computers and Mathematics in Miami, FL with 6.3%.
What is the Percentage of Population with a Degree in Computers and Mathematics in Miami, FL?
Percentage of Population with a Degree in Computers and Mathematics in Miami is 3.7%.
What is the Percentage of Population with a Degree in Computers and Mathematics in Florida?
Percentage of Population with a Degree in Computers and Mathematics in Florida is 4.1%.
What is the Percentage of Population with a Degree in Computers and Mathematics in the United States?
Percentage of Population with a Degree in Computers and Mathematics in the United States is 4.9%.