Zip Codes with the Highest Percentage of Population with a Degree in Literature and Languages in Miami, FL

RELATED REPORTS & OPTIONS

Literature and Languages
Population
Families and Households
Female Fertility
Female Fertility (Unmarried)
Race (Community Size)
Race (Percentage)
Ancestry (Community Size)
AfghanAfricanAlbanianAmericanApacheArabArgentineanArmenianAustralianAustrianBahamianBarbadianBasqueBelgianBelizeanBermudanBhutaneseBlackfeetBolivianBrazilianBritishBritish West IndianBulgarianBurmeseCanadianCelticCentral AmericanCentral American IndianCherokeeChickasawChileanChippewaChoctawColombianComancheCosta RicanCreekCroatianCubanCypriotCzechCzechoslovakianDanishDominicanDutchDutch West IndianEastern EuropeanEcuadorianEgyptianEnglishEstonianEthiopianEuropeanFilipinoFinnishFrenchFrench American IndianFrench CanadianGermanGreekGuamanian / ChamorroGuatemalanGuyaneseHaitianHonduranHungarianIcelanderIndian (Asian)IndonesianInupiatIranianIraqiIrishIroquoisIsraeliItalianJamaicanJapaneseJordanianKenyanKoreanLaotianLatvianLebaneseLithuanianMacedonianMalaysianMalteseMexicanMexican American IndianMongolianMoroccanNative HawaiianNavajoNew ZealanderNicaraguanNigerianNorthern EuropeanNorwegianPakistaniPalestinianPanamanianParaguayanPennsylvania GermanPeruvianPolishPortuguesePuerto RicanRomanianRussianSalvadoranSamoanScandinavianScotch-IrishScottishSeminoleSenegaleseSerbianSiouxSlavicSlovakSloveneSouth AfricanSouth AmericanSouth American IndianSpaniardSpanishSpanish AmericanSpanish American IndianSri LankanSubsaharan AfricanSudaneseSwedishSwissSyrianThaiTrinidadian and TobagonianTurkishU.S. Virgin IslanderUkrainianUruguayanVenezuelanVietnameseWelshWest IndianYugoslavianZimbabwean
Ancestry (Percentage)
AfghanAfricanAlbanianAmericanApacheArabArgentineanArmenianAustralianAustrianBahamianBarbadianBasqueBelgianBelizeanBermudanBhutaneseBlackfeetBolivianBrazilianBritishBritish West IndianBulgarianBurmeseCanadianCelticCentral AmericanCentral American IndianCherokeeChickasawChileanChippewaChoctawColombianComancheCosta RicanCreekCroatianCubanCypriotCzechCzechoslovakianDanishDominicanDutchDutch West IndianEastern EuropeanEcuadorianEgyptianEnglishEstonianEthiopianEuropeanFilipinoFinnishFrenchFrench American IndianFrench CanadianGermanGreekGuamanian / ChamorroGuatemalanGuyaneseHaitianHonduranHungarianIcelanderIndian (Asian)IndonesianInupiatIranianIraqiIrishIroquoisIsraeliItalianJamaicanJapaneseJordanianKenyanKoreanLaotianLatvianLebaneseLithuanianMacedonianMalaysianMalteseMexicanMexican American IndianMongolianMoroccanNative HawaiianNavajoNew ZealanderNicaraguanNigerianNorthern EuropeanNorwegianPakistaniPalestinianPanamanianParaguayanPennsylvania GermanPeruvianPolishPortuguesePuerto RicanRomanianRussianSalvadoranSamoanScandinavianScotch-IrishScottishSeminoleSenegaleseSerbianSiouxSlavicSlovakSloveneSouth AfricanSouth AmericanSouth American IndianSpaniardSpanishSpanish AmericanSpanish American IndianSri LankanSubsaharan AfricanSudaneseSwedishSwissSyrianThaiTrinidadian and TobagonianTurkishU.S. Virgin IslanderUkrainianUruguayanVenezuelanVietnameseWelshWest IndianYugoslavianZimbabwean
Immigrant Origin (Total)
AfghanistanAfricaAlbaniaArgentinaArmeniaAsiaAustraliaAustriaBahamasBangladeshBarbadosBelarusBelgiumBelizeBoliviaBosnia and HerzegovinaBrazilBulgariaBurma / MyanmarCambodiaCameroonCanadaCaribbeanCentral AmericaChileChinaColombiaCosta RicaCroatiaCubaCzechoslovakiaDenmarkDominicaDominican RepublicEastern AfricaEastern AsiaEastern EuropeEcuadorEgyptEl SalvadorEnglandEthiopiaEuropeFranceGermanyGreeceGrenadaGuatemalaGuyanaHaitiHondurasHong KongHungaryIndiaIndonesiaIranIraqIrelandIsraelItalyJamaicaJapanJordanKazakhstanKenyaKoreaKuwaitLaosLatin AmericaLatviaLebanonLithuaniaMalaysiaMexicoMiddle AfricaMoldovaMoroccoNepalNetherlandsNicaraguaNigeriaNorthern AfricaNorthern EuropeNorwayOceaniaPakistanPanamaPeruPhilippinesPolandPortugalRomaniaRussiaSaudi ArabiaScotlandSerbiaSingaporeSouth AfricaSouth AmericaSouth Central AsiaSouth Eastern AsiaSouthern EuropeSpainSri LankaSt. Vincent and the GrenadinesSudanSwedenSwitzerlandSyriaTaiwanThailandTrinidad and TobagoTurkeyUgandaUkraineUruguayUzbekistanVenezuelaVietnamWest IndiesWestern AfricaWestern AsiaWestern EuropeZaireZimbabwe
Immigrant Origin (Percentage)
AfghanistanAfricaAlbaniaArgentinaArmeniaAsiaAustraliaAustriaBahamasBangladeshBarbadosBelarusBelgiumBelizeBoliviaBosnia and HerzegovinaBrazilBulgariaBurma / MyanmarCambodiaCameroonCanadaCaribbeanCentral AmericaChileChinaColombiaCosta RicaCroatiaCubaCzechoslovakiaDenmarkDominicaDominican RepublicEastern AfricaEastern AsiaEastern EuropeEcuadorEgyptEl SalvadorEnglandEthiopiaEuropeFranceGermanyGreeceGrenadaGuatemalaGuyanaHaitiHondurasHong KongHungaryIndiaIndonesiaIranIraqIrelandIsraelItalyJamaicaJapanJordanKazakhstanKenyaKoreaKuwaitLaosLatin AmericaLatviaLebanonLithuaniaMalaysiaMexicoMiddle AfricaMoldovaMoroccoNepalNetherlandsNicaraguaNigeriaNorthern AfricaNorthern EuropeNorwayOceaniaPakistanPanamaPeruPhilippinesPolandPortugalRomaniaRussiaSaudi ArabiaScotlandSerbiaSingaporeSouth AfricaSouth AmericaSouth Central AsiaSouth Eastern AsiaSouthern EuropeSpainSri LankaSt. Vincent and the GrenadinesSudanSwedenSwitzerlandSyriaTaiwanThailandTrinidad and TobagoTurkeyUgandaUkraineUruguayUzbekistanVenezuelaVietnamWest IndiesWestern AfricaWestern AsiaWestern EuropeZaireZimbabwe
Income
Income (Families)
Income (Households)
Poverty
Poverty (Families)
Unemployment
Employment Occupations
Employment Industries
Employer Class
Commute Time
Commute Means
School Enrollment
Education by Degree Field
Occupancy
Finances
Physical Characteristics
Miami
States
Florida Cities
AlachuaAltamonte SpringsApopkaArcadiaBoca RatonBonita SpringsBoynton BeachBradentonBrandonBrooksvilleCape CoralCasselberryClearwaterClermontCocoaCoral SpringsCrestviewCrystal RiverDade CityDavenportDaytona BeachDeerfield BeachDelandDelray BeachDeltonaDunnellonEdgewaterEnglewoodEustisFort LauderdaleFort MyersFort PierceFort Walton BeachGainesvilleGulf BreezeHialeahHolidayHollywoodHomesteadHomosassaHudsonInvernessJacksonvilleJupiterKissimmeeLake CityLake WalesLake WorthLakelandLand O LakesLargoLeesburgLehigh AcresLive OakLongwoodLutzMelbourneMerritt IslandMiamiMiami BeachMiltonNaplesNew Port RicheyNew Smyrna BeachNorth Fort MyersNorth PortOcalaOkeechobeeOpa LockaOrange ParkOrlandoOrmond BeachOviedoPalm BayPalm Beach GardensPalm CoastPalm HarborPanama CityPanama City BeachPensacolaPerryPinellas ParkPlant CityPompano BeachPort CharlottePort OrangePort Saint LuciePunta GordaRiverviewSaint AugustineSaint CloudSaint PetersburgSanfordSarasotaSebastianSebringSeminoleSpring HillStuartTallahasseeTampaTarpon SpringsThe VillagesTitusvilleValricoVeniceVero BeachWesley ChapelWest Palm BeachWinter HavenWinter ParkZephyrhills
Compare Zip Codes
Comparison Subject

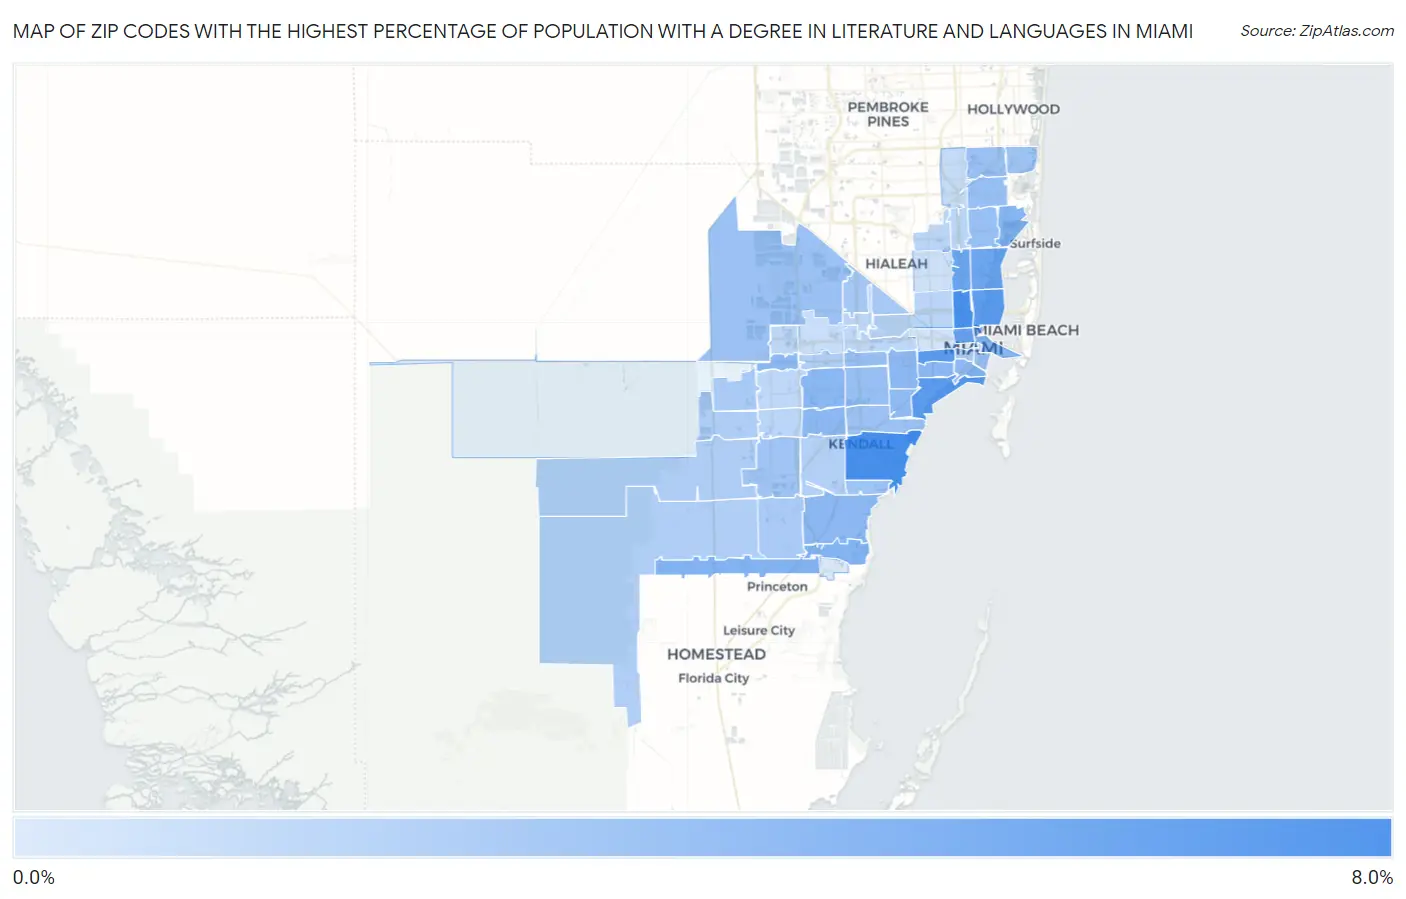
Map of Zip Codes with the Highest Percentage of Population with a Degree in Literature and Languages in Miami

0.0%
8.0%
Zip Codes with the Highest Percentage of Population with a Degree in Literature and Languages in Miami Map

Zip Codes with the Highest Percentage of Population with a Degree in Literature and Languages in Miami, FL

Zip Code % Graduates vs State vs National
1.331566.5%3.4%(+3.08)#634.4%(+2.07)#4,667
2.331276.3%3.4%(+2.93)#694.4%(+1.93)#4,881
3.331335.7%3.4%(+2.28)#974.4%(+1.27)#5,989
4.331355.6%3.4%(+2.18)#1084.4%(+1.17)#6,168
5.331375.4%3.4%(+2.05)#1164.4%(+1.04)#6,412
6.331365.1%3.4%(+1.70)#1414.4%(+0.687)#7,128
7.331504.9%3.4%(+1.49)#1654.4%(+0.479)#7,651
8.331384.9%3.4%(+1.47)#1664.4%(+0.460)#7,702
9.331704.0%3.4%(+0.620)#2884.4%(-0.388)#10,123
10.331894.0%3.4%(+0.565)#2944.4%(-0.443)#10,280
11.331813.9%3.4%(+0.484)#3074.4%(-0.523)#10,543
12.331453.7%3.4%(+0.314)#3534.4%(-0.694)#11,105
13.331653.7%3.4%(+0.261)#3624.4%(-0.747)#11,291
14.331323.7%3.4%(+0.255)#3644.4%(-0.753)#11,308
15.331733.6%3.4%(+0.214)#3664.4%(-0.793)#11,438
16.331343.6%3.4%(+0.182)#3704.4%(-0.826)#11,556
17.331573.6%3.4%(+0.170)#3744.4%(-0.838)#11,586
18.331843.6%3.4%(+0.168)#3754.4%(-0.840)#11,608
19.331293.5%3.4%(+0.061)#3914.4%(-0.947)#11,969
20.331463.4%3.4%(+0.000)#4034.4%(-1.01)#12,172
21.331553.1%3.4%(-0.274)#4564.4%(-1.28)#13,121
22.331443.1%3.4%(-0.283)#4584.4%(-1.29)#13,157
23.331623.1%3.4%(-0.304)#4674.4%(-1.31)#13,225
24.331613.1%3.4%(-0.350)#4754.4%(-1.36)#13,402
25.331432.9%3.4%(-0.490)#4984.4%(-1.50)#13,861
26.331782.9%3.4%(-0.517)#5034.4%(-1.52)#13,948
27.331792.9%3.4%(-0.528)#5044.4%(-1.54)#13,989
28.331582.8%3.4%(-0.577)#5124.4%(-1.58)#14,176
29.331862.7%3.4%(-0.694)#5284.4%(-1.70)#14,585
30.331802.7%3.4%(-0.722)#5314.4%(-1.73)#14,677
31.331312.6%3.4%(-0.779)#5394.4%(-1.79)#14,865
32.331662.6%3.4%(-0.846)#5544.4%(-1.85)#15,110
33.331852.4%3.4%(-1.05)#5854.4%(-2.06)#15,860
34.331772.3%3.4%(-1.10)#5944.4%(-2.11)#16,043
35.331962.2%3.4%(-1.22)#6124.4%(-2.23)#16,461
36.331932.2%3.4%(-1.23)#6184.4%(-2.24)#16,505
37.331302.1%3.4%(-1.30)#6314.4%(-2.31)#16,734
38.331872.0%3.4%(-1.36)#6454.4%(-2.37)#16,933
39.331742.0%3.4%(-1.36)#6464.4%(-2.37)#16,947
40.331762.0%3.4%(-1.44)#6594.4%(-2.45)#17,201
41.331671.7%3.4%(-1.73)#6984.4%(-2.73)#18,098
42.331831.6%3.4%(-1.76)#7054.4%(-2.77)#18,225
43.331421.6%3.4%(-1.77)#7064.4%(-2.77)#18,229
44.331681.6%3.4%(-1.77)#7084.4%(-2.77)#18,235
45.331221.6%3.4%(-1.78)#7104.4%(-2.79)#18,291
46.331821.6%3.4%(-1.81)#7134.4%(-2.82)#18,365
47.331751.5%3.4%(-1.94)#7244.4%(-2.95)#18,805
48.331261.5%3.4%(-1.95)#7274.4%(-2.96)#18,831
49.331691.2%3.4%(-2.21)#7604.4%(-3.21)#19,596
50.331721.1%3.4%(-2.27)#7684.4%(-3.28)#19,768
51.331470.82%3.4%(-2.58)#8004.4%(-3.59)#20,566
52.331250.76%3.4%(-2.64)#8074.4%(-3.65)#20,709
53.331900.28%3.4%(-3.12)#8334.4%(-4.13)#21,550

Common Questions

What are the Top 10 Zip Codes with the Highest Percentage of Population with a Degree in Literature and Languages in Miami, FL?
Top 10 Zip Codes with the Highest Percentage of Population with a Degree in Literature and Languages in Miami, FL are:
#1
6.5%
#2
6.3%
#3
5.7%
#4
5.6%
#5
5.4%
#6
5.1%
#7
4.9%
#8
4.9%
#9
4.0%
#10
4.0%
What zip code has the Highest Percentage of Population with a Degree in Literature and Languages in Miami, FL?
33156 has the Highest Percentage of Population with a Degree in Literature and Languages in Miami, FL with 6.5%.
What is the Percentage of Population with a Degree in Literature and Languages in Miami, FL?
Percentage of Population with a Degree in Literature and Languages in Miami is 3.5%.
What is the Percentage of Population with a Degree in Literature and Languages in Florida?
Percentage of Population with a Degree in Literature and Languages in Florida is 3.4%.
What is the Percentage of Population with a Degree in Literature and Languages in the United States?
Percentage of Population with a Degree in Literature and Languages in the United States is 4.4%.