Zip Codes with the Highest Percentage of Population Employed in Firefighting & Prevention in Miami, FL

RELATED REPORTS & OPTIONS

Firefighting & Prevention
Population
Families and Households
Female Fertility
Female Fertility (Unmarried)
Race (Community Size)
Race (Percentage)
Ancestry (Community Size)
AfghanAfricanAlbanianAmericanApacheArabArgentineanArmenianAustralianAustrianBahamianBarbadianBasqueBelgianBelizeanBermudanBhutaneseBlackfeetBolivianBrazilianBritishBritish West IndianBulgarianBurmeseCanadianCelticCentral AmericanCentral American IndianCherokeeChickasawChileanChippewaChoctawColombianComancheCosta RicanCreekCroatianCubanCypriotCzechCzechoslovakianDanishDominicanDutchDutch West IndianEastern EuropeanEcuadorianEgyptianEnglishEstonianEthiopianEuropeanFilipinoFinnishFrenchFrench American IndianFrench CanadianGermanGreekGuamanian / ChamorroGuatemalanGuyaneseHaitianHonduranHungarianIcelanderIndian (Asian)IndonesianInupiatIranianIraqiIrishIroquoisIsraeliItalianJamaicanJapaneseJordanianKenyanKoreanLaotianLatvianLebaneseLithuanianMacedonianMalaysianMalteseMexicanMexican American IndianMongolianMoroccanNative HawaiianNavajoNew ZealanderNicaraguanNigerianNorthern EuropeanNorwegianPakistaniPalestinianPanamanianParaguayanPennsylvania GermanPeruvianPolishPortuguesePuerto RicanRomanianRussianSalvadoranSamoanScandinavianScotch-IrishScottishSeminoleSenegaleseSerbianSiouxSlavicSlovakSloveneSouth AfricanSouth AmericanSouth American IndianSpaniardSpanishSpanish AmericanSpanish American IndianSri LankanSubsaharan AfricanSudaneseSwedishSwissSyrianThaiTrinidadian and TobagonianTurkishU.S. Virgin IslanderUkrainianUruguayanVenezuelanVietnameseWelshWest IndianYugoslavianZimbabwean
Ancestry (Percentage)
AfghanAfricanAlbanianAmericanApacheArabArgentineanArmenianAustralianAustrianBahamianBarbadianBasqueBelgianBelizeanBermudanBhutaneseBlackfeetBolivianBrazilianBritishBritish West IndianBulgarianBurmeseCanadianCelticCentral AmericanCentral American IndianCherokeeChickasawChileanChippewaChoctawColombianComancheCosta RicanCreekCroatianCubanCypriotCzechCzechoslovakianDanishDominicanDutchDutch West IndianEastern EuropeanEcuadorianEgyptianEnglishEstonianEthiopianEuropeanFilipinoFinnishFrenchFrench American IndianFrench CanadianGermanGreekGuamanian / ChamorroGuatemalanGuyaneseHaitianHonduranHungarianIcelanderIndian (Asian)IndonesianInupiatIranianIraqiIrishIroquoisIsraeliItalianJamaicanJapaneseJordanianKenyanKoreanLaotianLatvianLebaneseLithuanianMacedonianMalaysianMalteseMexicanMexican American IndianMongolianMoroccanNative HawaiianNavajoNew ZealanderNicaraguanNigerianNorthern EuropeanNorwegianPakistaniPalestinianPanamanianParaguayanPennsylvania GermanPeruvianPolishPortuguesePuerto RicanRomanianRussianSalvadoranSamoanScandinavianScotch-IrishScottishSeminoleSenegaleseSerbianSiouxSlavicSlovakSloveneSouth AfricanSouth AmericanSouth American IndianSpaniardSpanishSpanish AmericanSpanish American IndianSri LankanSubsaharan AfricanSudaneseSwedishSwissSyrianThaiTrinidadian and TobagonianTurkishU.S. Virgin IslanderUkrainianUruguayanVenezuelanVietnameseWelshWest IndianYugoslavianZimbabwean
Immigrant Origin (Total)
AfghanistanAfricaAlbaniaArgentinaArmeniaAsiaAustraliaAustriaBahamasBangladeshBarbadosBelarusBelgiumBelizeBoliviaBosnia and HerzegovinaBrazilBulgariaBurma / MyanmarCambodiaCameroonCanadaCaribbeanCentral AmericaChileChinaColombiaCosta RicaCroatiaCubaCzechoslovakiaDenmarkDominicaDominican RepublicEastern AfricaEastern AsiaEastern EuropeEcuadorEgyptEl SalvadorEnglandEthiopiaEuropeFranceGermanyGreeceGrenadaGuatemalaGuyanaHaitiHondurasHong KongHungaryIndiaIndonesiaIranIraqIrelandIsraelItalyJamaicaJapanJordanKazakhstanKenyaKoreaKuwaitLaosLatin AmericaLatviaLebanonLithuaniaMalaysiaMexicoMiddle AfricaMoldovaMoroccoNepalNetherlandsNicaraguaNigeriaNorthern AfricaNorthern EuropeNorwayOceaniaPakistanPanamaPeruPhilippinesPolandPortugalRomaniaRussiaSaudi ArabiaScotlandSerbiaSingaporeSouth AfricaSouth AmericaSouth Central AsiaSouth Eastern AsiaSouthern EuropeSpainSri LankaSt. Vincent and the GrenadinesSudanSwedenSwitzerlandSyriaTaiwanThailandTrinidad and TobagoTurkeyUgandaUkraineUruguayUzbekistanVenezuelaVietnamWest IndiesWestern AfricaWestern AsiaWestern EuropeZaireZimbabwe
Immigrant Origin (Percentage)
AfghanistanAfricaAlbaniaArgentinaArmeniaAsiaAustraliaAustriaBahamasBangladeshBarbadosBelarusBelgiumBelizeBoliviaBosnia and HerzegovinaBrazilBulgariaBurma / MyanmarCambodiaCameroonCanadaCaribbeanCentral AmericaChileChinaColombiaCosta RicaCroatiaCubaCzechoslovakiaDenmarkDominicaDominican RepublicEastern AfricaEastern AsiaEastern EuropeEcuadorEgyptEl SalvadorEnglandEthiopiaEuropeFranceGermanyGreeceGrenadaGuatemalaGuyanaHaitiHondurasHong KongHungaryIndiaIndonesiaIranIraqIrelandIsraelItalyJamaicaJapanJordanKazakhstanKenyaKoreaKuwaitLaosLatin AmericaLatviaLebanonLithuaniaMalaysiaMexicoMiddle AfricaMoldovaMoroccoNepalNetherlandsNicaraguaNigeriaNorthern AfricaNorthern EuropeNorwayOceaniaPakistanPanamaPeruPhilippinesPolandPortugalRomaniaRussiaSaudi ArabiaScotlandSerbiaSingaporeSouth AfricaSouth AmericaSouth Central AsiaSouth Eastern AsiaSouthern EuropeSpainSri LankaSt. Vincent and the GrenadinesSudanSwedenSwitzerlandSyriaTaiwanThailandTrinidad and TobagoTurkeyUgandaUkraineUruguayUzbekistanVenezuelaVietnamWest IndiesWestern AfricaWestern AsiaWestern EuropeZaireZimbabwe
Income
Income (Families)
Income (Households)
Poverty
Poverty (Families)
Unemployment
Employment Occupations
Employment Industries
Employer Class
Commute Time
Commute Means
School Enrollment
Education by Degree Field
Occupancy
Finances
Physical Characteristics
Miami
States
Florida Cities
Altamonte SpringsApopkaArcadiaBoca RatonBonita SpringsBoynton BeachBradentonBrandonBrooksvilleCape CoralCasselberryClearwaterClermontCocoaCoral SpringsCrestviewDade CityDavenportDaytona BeachDeerfield BeachDefuniak SpringsDelandDelray BeachDeltonaDunnellonEdgewaterEnglewoodEustisFort LauderdaleFort MyersFort PierceFort Walton BeachGainesvilleGulf BreezeHialeahHolidayHollywoodHomesteadHomosassaHudsonInvernessJacksonvilleJupiterKissimmeeLake CityLake WalesLake WorthLakelandLand O LakesLargoLeesburgLehigh AcresLive OakLongwoodLutzMariannaMelbourneMerritt IslandMiamiMiami BeachMiltonNaplesNew Port RicheyNew Smyrna BeachNorth Fort MyersNorth PortOcalaOkeechobeeOpa LockaOrange ParkOrlandoOrmond BeachOviedoPalm BayPalm Beach GardensPalm CoastPalm HarborPanama CityPanama City BeachPensacolaPinellas ParkPlant CityPompano BeachPort CharlottePort OrangePort Saint LuciePunta GordaQuincyRiverviewSaint AugustineSaint CloudSaint PetersburgSanfordSarasotaSebringSeminoleSpring HillStuartTallahasseeTampaTarpon SpringsThe VillagesTitusvilleValricoVeniceVero BeachWesley ChapelWest Palm BeachWinter HavenWinter ParkZephyrhills
Compare Zip Codes
Comparison Subject

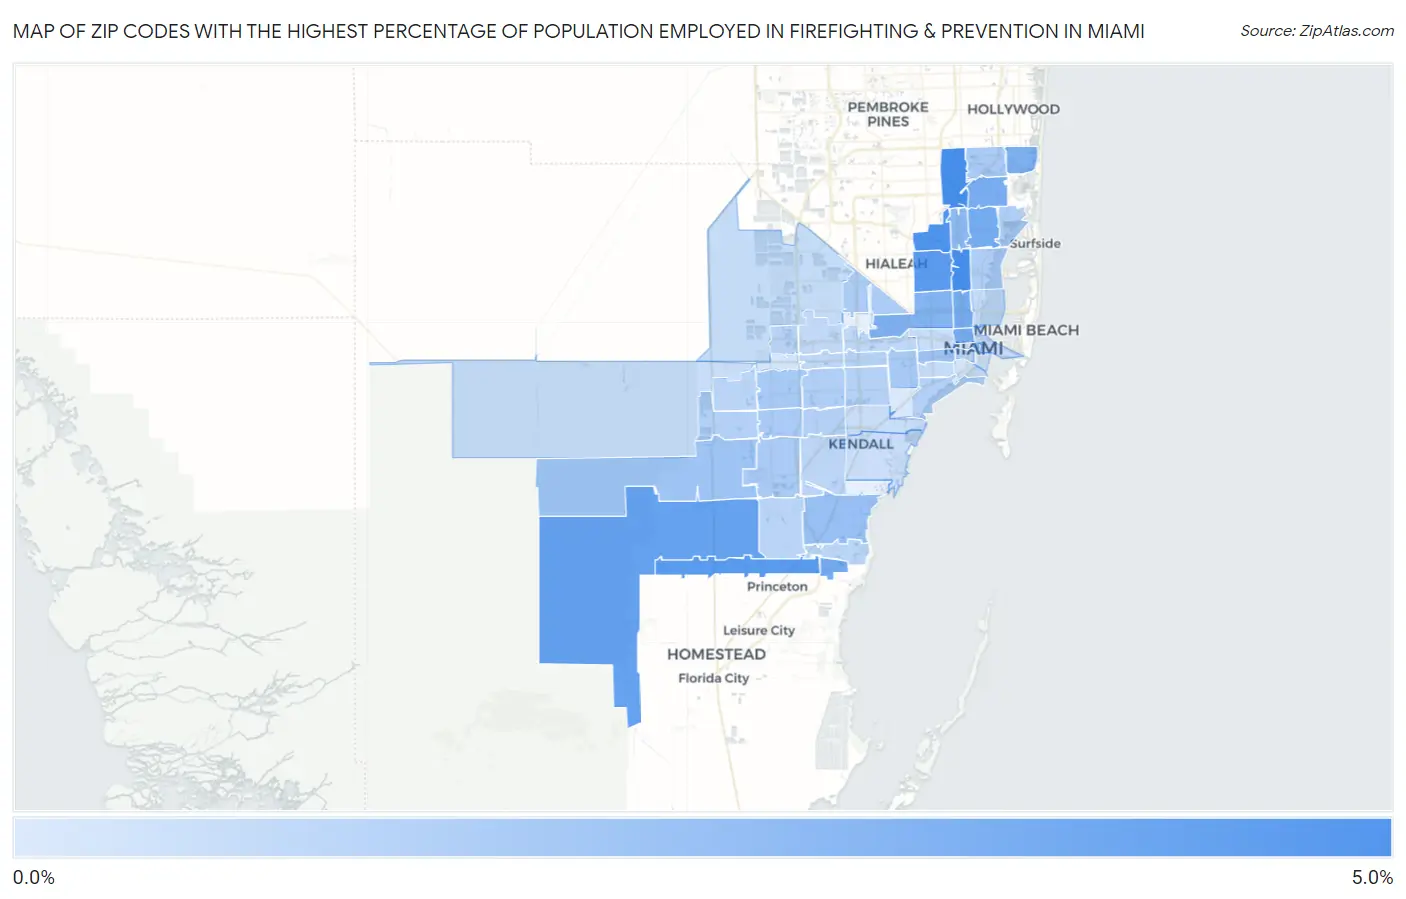
Map of Zip Codes with the Highest Percentage of Population Employed in Firefighting & Prevention in Miami

0.0%
5.0%
Zip Codes with the Highest Percentage of Population Employed in Firefighting & Prevention in Miami Map

Zip Codes with the Highest Percentage of Population Employed in Firefighting & Prevention in Miami, FL

Zip Code % Employed vs State vs National
1.331504.8%1.4%(+3.35)#171.2%(+3.57)#1,004
2.331694.7%1.4%(+3.33)#181.2%(+3.55)#1,012
3.331674.5%1.4%(+3.11)#191.2%(+3.32)#1,099
4.331704.2%1.4%(+2.81)#221.2%(+3.03)#1,249
5.331474.1%1.4%(+2.69)#231.2%(+2.90)#1,299
6.331873.8%1.4%(+2.37)#301.2%(+2.58)#1,494
7.331613.3%1.4%(+1.92)#471.2%(+2.14)#1,879
8.331273.3%1.4%(+1.92)#481.2%(+2.13)#1,884
9.331903.3%1.4%(+1.90)#501.2%(+2.11)#1,901
10.331363.2%1.4%(+1.83)#571.2%(+2.04)#1,985
11.331623.1%1.4%(+1.74)#591.2%(+1.96)#2,088
12.331803.0%1.4%(+1.61)#681.2%(+1.82)#2,237
13.331422.9%1.4%(+1.47)#731.2%(+1.69)#2,427
14.331682.6%1.4%(+1.15)#1061.2%(+1.36)#2,989
15.331572.2%1.4%(+0.806)#1411.2%(+1.02)#3,841
16.331352.1%1.4%(+0.680)#1591.2%(+0.896)#4,211
17.331962.0%1.4%(+0.633)#1691.2%(+0.849)#4,389
18.331341.7%1.4%(+0.286)#2471.2%(+0.501)#5,910
19.331751.7%1.4%(+0.280)#2481.2%(+0.496)#5,931
20.331791.7%1.4%(+0.250)#2581.2%(+0.465)#6,087
21.331831.6%1.4%(+0.224)#2681.2%(+0.440)#6,242
22.331861.6%1.4%(+0.215)#2721.2%(+0.431)#6,295
23.331661.6%1.4%(+0.187)#2781.2%(+0.403)#6,442
24.331381.5%1.4%(+0.082)#3081.2%(+0.297)#7,091
25.331651.4%1.4%(+0.021)#3231.2%(+0.237)#7,483
26.331811.4%1.4%(+0.006)#3321.2%(+0.222)#7,592
27.331331.4%1.4%(-0.027)#3441.2%(+0.189)#7,806
28.331931.4%1.4%(-0.041)#3511.2%(+0.175)#7,889
29.331731.3%1.4%(-0.054)#3571.2%(+0.161)#8,004
30.331441.3%1.4%(-0.144)#3841.2%(+0.072)#8,690
31.331551.3%1.4%(-0.146)#3851.2%(+0.070)#8,702
32.331821.2%1.4%(-0.157)#3891.2%(+0.059)#8,774
33.331771.2%1.4%(-0.220)#4141.2%(-0.004)#9,301
34.331891.2%1.4%(-0.225)#4221.2%(-0.010)#9,357
35.331851.2%1.4%(-0.242)#4291.2%(-0.026)#9,514
36.331301.1%1.4%(-0.293)#4601.2%(-0.078)#10,039
37.331761.1%1.4%(-0.322)#4791.2%(-0.106)#10,282
38.331261.0%1.4%(-0.400)#5261.2%(-0.184)#11,076
39.331740.98%1.4%(-0.420)#5401.2%(-0.205)#11,280
40.331720.94%1.4%(-0.461)#5551.2%(-0.245)#11,734
41.331450.85%1.4%(-0.553)#6001.2%(-0.338)#12,694
42.331780.77%1.4%(-0.628)#6331.2%(-0.413)#13,511
43.331370.76%1.4%(-0.639)#6371.2%(-0.423)#13,630
44.331430.75%1.4%(-0.652)#6391.2%(-0.436)#13,764
45.331320.74%1.4%(-0.657)#6421.2%(-0.442)#13,829
46.331940.73%1.4%(-0.668)#6461.2%(-0.452)#13,943
47.331250.72%1.4%(-0.678)#6561.2%(-0.462)#14,066
48.331560.65%1.4%(-0.751)#6861.2%(-0.536)#14,898
49.331290.38%1.4%(-1.02)#7721.2%(-0.805)#17,867
50.331840.37%1.4%(-1.03)#7761.2%(-0.817)#18,012
51.331280.36%1.4%(-1.04)#7831.2%(-0.825)#18,106
52.331460.15%1.4%(-1.25)#8231.2%(-1.04)#20,041
53.331310.092%1.4%(-1.31)#8331.2%(-1.09)#20,338

Common Questions

What are the Top 10 Zip Codes with the Highest Percentage of Population Employed in Firefighting & Prevention in Miami, FL?
Top 10 Zip Codes with the Highest Percentage of Population Employed in Firefighting & Prevention in Miami, FL are:
#1
4.8%
#2
4.7%
#3
4.5%
#4
4.2%
#5
4.1%
#6
3.8%
#7
3.3%
#8
3.3%
#9
3.3%
#10
3.2%
What zip code has the Highest Percentage of Population Employed in Firefighting & Prevention in Miami, FL?
33150 has the Highest Percentage of Population Employed in Firefighting & Prevention in Miami, FL with 4.8%.
What is the Percentage of Population Employed in Firefighting & Prevention in Miami, FL?
Percentage of Population Employed in Firefighting & Prevention in Miami is 1.5%.
What is the Percentage of Population Employed in Firefighting & Prevention in Florida?
Percentage of Population Employed in Firefighting & Prevention in Florida is 1.4%.
What is the Percentage of Population Employed in Firefighting & Prevention in the United States?
Percentage of Population Employed in Firefighting & Prevention in the United States is 1.2%.