Immigrants from Afghanistan vs Chinese Married-couple Households
COMPARE
Immigrants from Afghanistan
Chinese
Married-couple Households
Married-couple Households Comparison
Immigrants from Afghanistan
Chinese
47.2%
MARRIED-COUPLE HOUSEHOLDS
85.1/ 100
METRIC RATING
138th/ 347
METRIC RANK
50.4%
MARRIED-COUPLE HOUSEHOLDS
100.0/ 100
METRIC RATING
10th/ 347
METRIC RANK
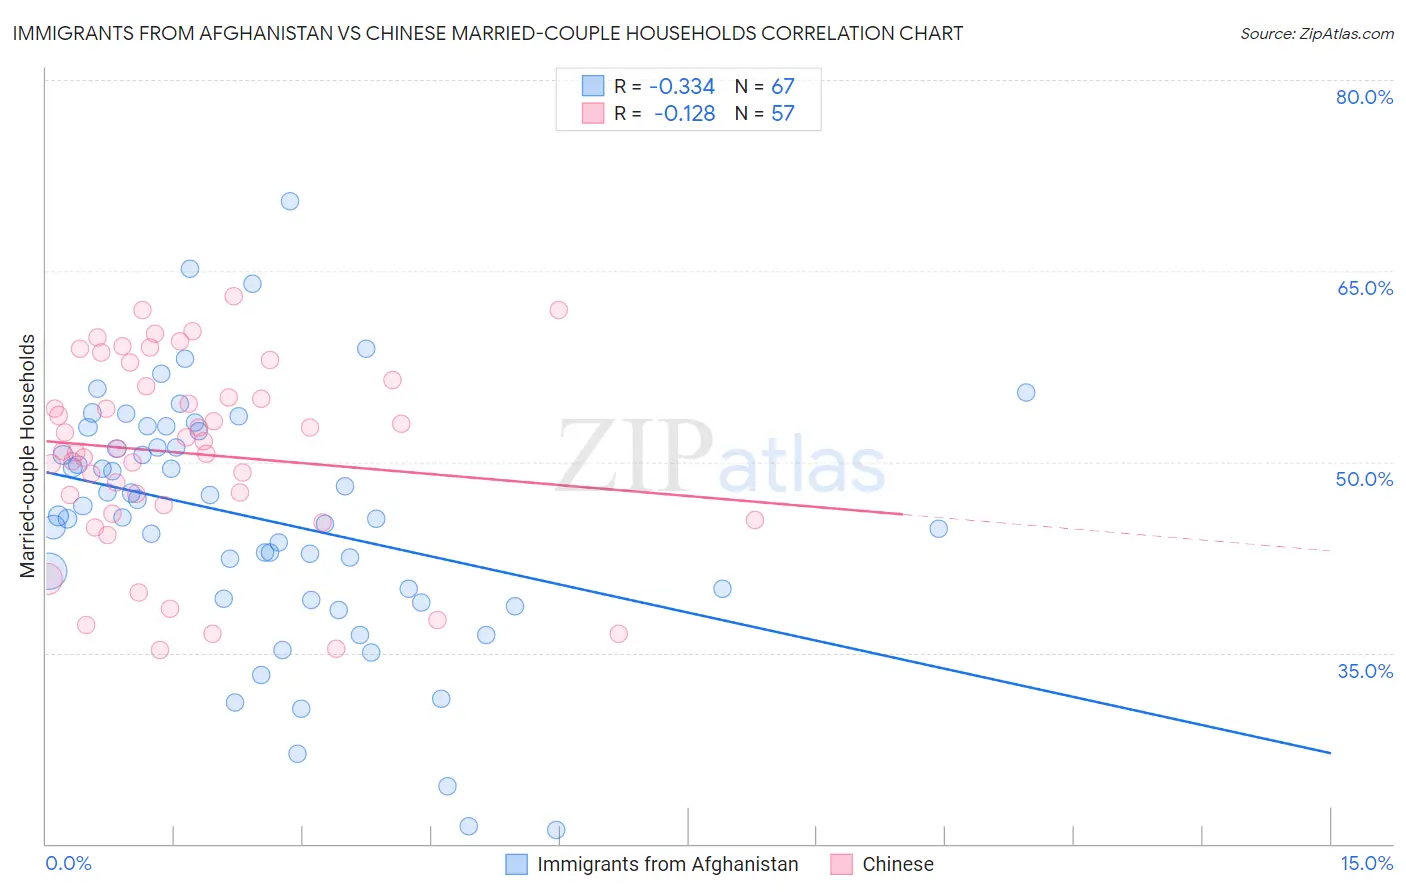
Immigrants from Afghanistan vs Chinese Married-couple Households Correlation Chart
The statistical analysis conducted on geographies consisting of 147,636,485 people shows a mild negative correlation between the proportion of Immigrants from Afghanistan and percentage of married-couple family households in the United States with a correlation coefficient (R) of -0.334 and weighted average of 47.2%. Similarly, the statistical analysis conducted on geographies consisting of 64,801,742 people shows a poor negative correlation between the proportion of Chinese and percentage of married-couple family households in the United States with a correlation coefficient (R) of -0.128 and weighted average of 50.4%, a difference of 6.7%.
Married-couple Households Correlation Summary
| Measurement | Immigrants from Afghanistan | Chinese |
| Minimum | 21.1% | 35.3% |
| Maximum | 70.5% | 63.0% |
| Range | 49.4% | 27.8% |
| Mean | 45.5% | 50.6% |
| Median | 45.8% | 51.0% |
| Interquartile 25% (IQ1) | 39.3% | 46.3% |
| Interquartile 75% (IQ3) | 52.4% | 56.2% |
| Interquartile Range (IQR) | 13.1% | 9.9% |
| Standard Deviation (Sample) | 9.8% | 7.4% |
| Standard Deviation (Population) | 9.7% | 7.4% |
Similar Demographics by Married-couple Households
Demographics Similar to Immigrants from Afghanistan by Married-couple Households
In terms of married-couple households, the demographic groups most similar to Immigrants from Afghanistan are New Zealander (47.2%, a difference of 0.010%), Immigrants from Malaysia (47.2%, a difference of 0.010%), Immigrants from Sweden (47.2%, a difference of 0.030%), Spanish (47.2%, a difference of 0.050%), and Costa Rican (47.2%, a difference of 0.050%).
| Demographics | Rating | Rank | Married-couple Households |
| Immigrants | Denmark | 87.5 /100 | #131 | Excellent 47.3% |
| Immigrants | Ukraine | 86.7 /100 | #132 | Excellent 47.3% |
| South Africans | 86.4 /100 | #133 | Excellent 47.3% |
| Immigrants | Greece | 86.0 /100 | #134 | Excellent 47.2% |
| Immigrants | Argentina | 86.0 /100 | #135 | Excellent 47.2% |
| New Zealanders | 85.3 /100 | #136 | Excellent 47.2% |
| Immigrants | Malaysia | 85.2 /100 | #137 | Excellent 47.2% |
| Immigrants | Afghanistan | 85.1 /100 | #138 | Excellent 47.2% |
| Immigrants | Sweden | 84.7 /100 | #139 | Excellent 47.2% |
| Spanish | 84.5 /100 | #140 | Excellent 47.2% |
| Costa Ricans | 84.4 /100 | #141 | Excellent 47.2% |
| Spaniards | 84.1 /100 | #142 | Excellent 47.2% |
| Immigrants | Belarus | 83.8 /100 | #143 | Excellent 47.2% |
| Mexicans | 83.4 /100 | #144 | Excellent 47.1% |
| Slovenes | 81.7 /100 | #145 | Excellent 47.1% |
Demographics Similar to Chinese by Married-couple Households
In terms of married-couple households, the demographic groups most similar to Chinese are Pennsylvania German (50.4%, a difference of 0.0%), Immigrants from Pakistan (50.1%, a difference of 0.44%), Immigrants from South Central Asia (50.6%, a difference of 0.55%), Swiss (49.9%, a difference of 0.81%), and Immigrants from Korea (49.9%, a difference of 0.98%).
| Demographics | Rating | Rank | Married-couple Households |
| Thais | 100.0 /100 | #3 | Exceptional 51.9% |
| Assyrians/Chaldeans/Syriacs | 100.0 /100 | #4 | Exceptional 51.8% |
| Tongans | 100.0 /100 | #5 | Exceptional 51.6% |
| Danes | 100.0 /100 | #6 | Exceptional 51.1% |
| Filipinos | 100.0 /100 | #7 | Exceptional 51.0% |
| Immigrants | South Central Asia | 100.0 /100 | #8 | Exceptional 50.6% |
| Pennsylvania Germans | 100.0 /100 | #9 | Exceptional 50.4% |
| Chinese | 100.0 /100 | #10 | Exceptional 50.4% |
| Immigrants | Pakistan | 100.0 /100 | #11 | Exceptional 50.1% |
| Swiss | 100.0 /100 | #12 | Exceptional 49.9% |
| Immigrants | Korea | 100.0 /100 | #13 | Exceptional 49.9% |
| Burmese | 100.0 /100 | #14 | Exceptional 49.8% |
| Koreans | 99.9 /100 | #15 | Exceptional 49.7% |
| Swedes | 99.9 /100 | #16 | Exceptional 49.7% |
| Immigrants | Hong Kong | 99.9 /100 | #17 | Exceptional 49.6% |