Immigrants from Afghanistan vs Comanche Married-couple Households
COMPARE
Immigrants from Afghanistan
Comanche
Married-couple Households
Married-couple Households Comparison
Immigrants from Afghanistan
Comanche
47.2%
MARRIED-COUPLE HOUSEHOLDS
85.1/ 100
METRIC RATING
138th/ 347
METRIC RANK
44.5%
MARRIED-COUPLE HOUSEHOLDS
1.2/ 100
METRIC RATING
237th/ 347
METRIC RANK
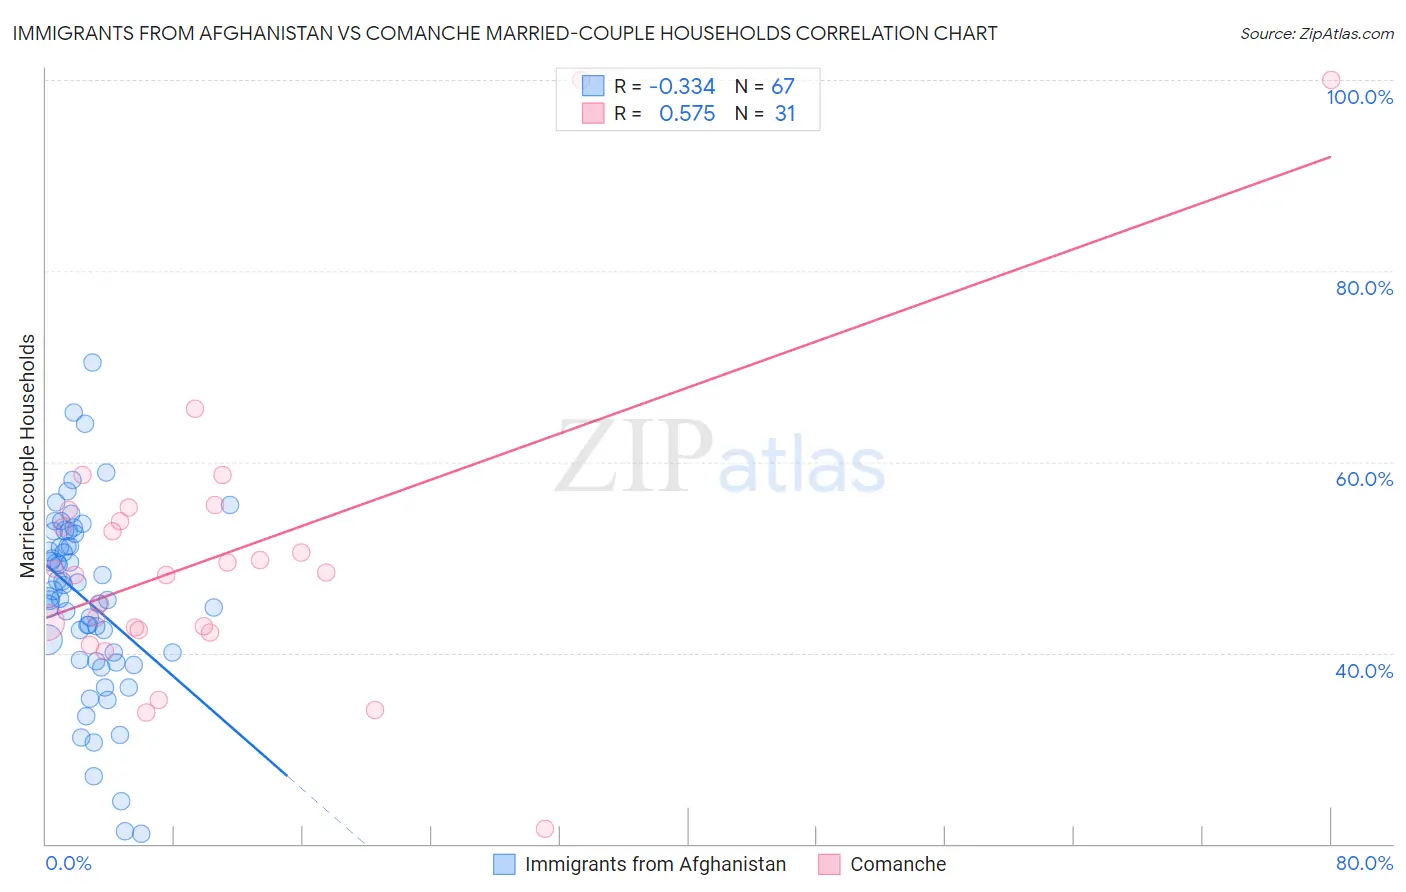
Immigrants from Afghanistan vs Comanche Married-couple Households Correlation Chart
The statistical analysis conducted on geographies consisting of 147,636,485 people shows a mild negative correlation between the proportion of Immigrants from Afghanistan and percentage of married-couple family households in the United States with a correlation coefficient (R) of -0.334 and weighted average of 47.2%. Similarly, the statistical analysis conducted on geographies consisting of 109,768,112 people shows a substantial positive correlation between the proportion of Comanche and percentage of married-couple family households in the United States with a correlation coefficient (R) of 0.575 and weighted average of 44.5%, a difference of 6.1%.
Married-couple Households Correlation Summary
| Measurement | Immigrants from Afghanistan | Comanche |
| Minimum | 21.1% | 21.6% |
| Maximum | 70.5% | 100.0% |
| Range | 49.4% | 78.4% |
| Mean | 45.5% | 50.3% |
| Median | 45.8% | 48.4% |
| Interquartile 25% (IQ1) | 39.3% | 42.4% |
| Interquartile 75% (IQ3) | 52.4% | 55.0% |
| Interquartile Range (IQR) | 13.1% | 12.6% |
| Standard Deviation (Sample) | 9.8% | 15.9% |
| Standard Deviation (Population) | 9.7% | 15.6% |
Similar Demographics by Married-couple Households
Demographics Similar to Immigrants from Afghanistan by Married-couple Households
In terms of married-couple households, the demographic groups most similar to Immigrants from Afghanistan are New Zealander (47.2%, a difference of 0.010%), Immigrants from Malaysia (47.2%, a difference of 0.010%), Immigrants from Sweden (47.2%, a difference of 0.030%), Spanish (47.2%, a difference of 0.050%), and Costa Rican (47.2%, a difference of 0.050%).
| Demographics | Rating | Rank | Married-couple Households |
| Immigrants | Denmark | 87.5 /100 | #131 | Excellent 47.3% |
| Immigrants | Ukraine | 86.7 /100 | #132 | Excellent 47.3% |
| South Africans | 86.4 /100 | #133 | Excellent 47.3% |
| Immigrants | Greece | 86.0 /100 | #134 | Excellent 47.2% |
| Immigrants | Argentina | 86.0 /100 | #135 | Excellent 47.2% |
| New Zealanders | 85.3 /100 | #136 | Excellent 47.2% |
| Immigrants | Malaysia | 85.2 /100 | #137 | Excellent 47.2% |
| Immigrants | Afghanistan | 85.1 /100 | #138 | Excellent 47.2% |
| Immigrants | Sweden | 84.7 /100 | #139 | Excellent 47.2% |
| Spanish | 84.5 /100 | #140 | Excellent 47.2% |
| Costa Ricans | 84.4 /100 | #141 | Excellent 47.2% |
| Spaniards | 84.1 /100 | #142 | Excellent 47.2% |
| Immigrants | Belarus | 83.8 /100 | #143 | Excellent 47.2% |
| Mexicans | 83.4 /100 | #144 | Excellent 47.1% |
| Slovenes | 81.7 /100 | #145 | Excellent 47.1% |
Demographics Similar to Comanche by Married-couple Households
In terms of married-couple households, the demographic groups most similar to Comanche are Yaqui (44.5%, a difference of 0.030%), Immigrants from Nicaragua (44.5%, a difference of 0.040%), Immigrants from Uruguay (44.5%, a difference of 0.050%), Spanish American (44.5%, a difference of 0.070%), and Immigrants from Panama (44.6%, a difference of 0.11%).
| Demographics | Rating | Rank | Married-couple Households |
| Soviet Union | 1.6 /100 | #230 | Tragic 44.6% |
| Houma | 1.5 /100 | #231 | Tragic 44.6% |
| Marshallese | 1.5 /100 | #232 | Tragic 44.6% |
| Immigrants | Uganda | 1.5 /100 | #233 | Tragic 44.6% |
| Immigrants | Panama | 1.3 /100 | #234 | Tragic 44.6% |
| Immigrants | Nicaragua | 1.2 /100 | #235 | Tragic 44.5% |
| Yaqui | 1.2 /100 | #236 | Tragic 44.5% |
| Comanche | 1.2 /100 | #237 | Tragic 44.5% |
| Immigrants | Uruguay | 1.1 /100 | #238 | Tragic 44.5% |
| Spanish Americans | 1.1 /100 | #239 | Tragic 44.5% |
| Ute | 1.0 /100 | #240 | Tragic 44.4% |
| Immigrants | Bosnia and Herzegovina | 1.0 /100 | #241 | Tragic 44.4% |
| Immigrants | Albania | 1.0 /100 | #242 | Tragic 44.4% |
| Immigrants | Saudi Arabia | 0.9 /100 | #243 | Tragic 44.4% |
| Immigrants | Armenia | 0.7 /100 | #244 | Tragic 44.3% |