Scandinavian vs Immigrants from Western Asia Disability Age Under 5

COMPARE

Scandinavian
Race
Ancestry
AfghanAfricanAlaska NativeAlaskan AthabascanAlbanianAleutAlsatianAmericanApacheArabArapahoArgentineanArmenianAssyrian/Chaldean/SyriacAustralianAustrianBahamianBangladeshiBarbadianBasqueBelgianBelizeanBermudanBhutaneseBlackfeetBolivianBrazilianBritishBritish West IndianBulgarianBurmeseCajunCambodianCanadianCape VerdeanCarpatho RusynCelticCentral AmericanCentral American IndianCherokeeCheyenneChickasawChileanChineseChippewaChoctawColombianColvilleComancheCosta RicanCreeCreekCroatianCrowCubanCypriotCzechCzechoslovakianDanishDelawareDominicanDutchDutch West IndianEastern EuropeanEcuadorianEgyptianEnglishEstonianEthiopianEuropeanFijianFilipinoFinnishFrenchFrench American IndianFrench CanadianGermanGerman RussianGhanaianGreekGuamanian/ChamorroGuatemalanGuyaneseHaitianHmongHonduranHopiHoumaHungarianIcelanderIndian (Asian)IndonesianInupiatIranianIraqiIrishIroquoisIsraeliItalianJamaicanJapaneseJordanianKenyanKiowaKoreanLaotianLatvianLebaneseLiberianLithuanianLumbeeLuxembourgerMacedonianMalaysianMalteseMarshalleseMenomineeMexicanMexican American IndianMongolianMoroccanNative HawaiianNavajoNepaleseNew ZealanderNicaraguanNigerianNorthern EuropeanNorwegianOkinawanOsageOttawaPaiutePakistaniPalestinianPanamanianParaguayanPennsylvania GermanPeruvianPimaPolishPortuguesePotawatomiPuebloPuerto RicanPuget Sound SalishRomanianRussianSalvadoranSamoanScandinavianScotch-IrishScottishSeminoleSenegaleseSerbianShoshoneSierra LeoneanSiouxSlavicSlovakSloveneSomaliSouth AfricanSouth AmericanSouth American IndianSoviet UnionSpaniardSpanishSpanish AmericanSpanish American IndianSri LankanSubsaharan AfricanSudaneseSwedishSwissSyrianTaiwaneseThaiTlingit-HaidaTohono O'OdhamTonganTrinidadian and TobagonianTsimshianTurkishU.S. Virgin IslanderUgandanUkrainianUruguayanUteVenezuelanVietnameseWelshWest IndianYakamaYaquiYugoslavianYumanYup'ikZimbabwean
Immigration
NonimmigrantsImmigrantsAfghanistanAfricaAlbaniaArgentinaArmeniaAsiaAustraliaAustriaBahamasBangladeshBarbadosBelarusBelgiumBelizeBoliviaBosnia and HerzegovinaBrazilBulgariaBurma/MyanmarCabo VerdeCambodiaCameroonCanadaCaribbeanCentral AmericaChileChinaColombiaCongoCosta RicaCroatiaCubaCzechoslovakiaDenmarkDominicaDominican RepublicEastern AfricaEastern AsiaEastern EuropeEcuadorEgyptEl SalvadorEnglandEritreaEthiopiaEuropeFijiFranceGermanyGhanaGreeceGrenadaGuatemalaGuyanaHaitiHondurasHong KongHungaryIndiaIndonesiaIranIraqIrelandIsraelItalyJamaicaJapanJordanKazakhstanKenyaKoreaKuwaitLaosLatin AmericaLatviaLebanonLiberiaLithuaniaMalaysiaMexicoMicronesiaMiddle AfricaMoldovaMoroccoNepalNetherlandsNicaraguaNigeriaNorth AmericaNorth MacedoniaNorthern AfricaNorthern EuropeNorwayOceaniaPakistanPanamaPeruPhilippinesPolandPortugalRomaniaRussiaSaudi ArabiaScotlandSenegalSerbiaSierra LeoneSingaporeSomaliaSouth AfricaSouth AmericaSouth Central AsiaSouth Eastern AsiaSouthern EuropeSpainSri LankaSt. Vincent and the GrenadinesSudanSwedenSwitzerlandSyriaTaiwanThailandTrinidad and TobagoTurkeyUgandaUkraineUruguayUzbekistanVenezuelaVietnamWest IndiesWestern AfricaWestern EuropeYemenZaireZimbabweAzores
Immigrants from Western Asia
Race
Ancestry
AfghanAfricanAlaska NativeAlaskan AthabascanAlbanianAleutAlsatianAmericanApacheArabArapahoArgentineanArmenianAssyrian/Chaldean/SyriacAustralianAustrianBahamianBangladeshiBarbadianBasqueBelgianBelizeanBermudanBhutaneseBlackfeetBolivianBrazilianBritishBritish West IndianBulgarianBurmeseCajunCambodianCanadianCape VerdeanCarpatho RusynCelticCentral AmericanCentral American IndianCherokeeCheyenneChickasawChileanChineseChippewaChoctawColombianColvilleComancheCosta RicanCreeCreekCroatianCrowCubanCypriotCzechCzechoslovakianDanishDelawareDominicanDutchDutch West IndianEastern EuropeanEcuadorianEgyptianEnglishEstonianEthiopianEuropeanFijianFilipinoFinnishFrenchFrench American IndianFrench CanadianGermanGerman RussianGhanaianGreekGuamanian/ChamorroGuatemalanGuyaneseHaitianHmongHonduranHopiHoumaHungarianIcelanderIndian (Asian)IndonesianInupiatIranianIraqiIrishIroquoisIsraeliItalianJamaicanJapaneseJordanianKenyanKiowaKoreanLaotianLatvianLebaneseLiberianLithuanianLumbeeLuxembourgerMacedonianMalaysianMalteseMarshalleseMenomineeMexicanMexican American IndianMongolianMoroccanNative HawaiianNavajoNepaleseNew ZealanderNicaraguanNigerianNorthern EuropeanNorwegianOkinawanOsageOttawaPaiutePakistaniPalestinianPanamanianParaguayanPennsylvania GermanPeruvianPimaPolishPortuguesePotawatomiPuebloPuerto RicanPuget Sound SalishRomanianRussianSalvadoranSamoanScotch-IrishScottishSeminoleSenegaleseSerbianShoshoneSierra LeoneanSiouxSlavicSlovakSloveneSomaliSouth AfricanSouth AmericanSouth American IndianSoviet UnionSpaniardSpanishSpanish AmericanSpanish American IndianSri LankanSubsaharan AfricanSudaneseSwedishSwissSyrianTaiwaneseThaiTlingit-HaidaTohono O'OdhamTonganTrinidadian and TobagonianTsimshianTurkishU.S. Virgin IslanderUgandanUkrainianUruguayanUteVenezuelanVietnameseWelshWest IndianYakamaYaquiYugoslavianYumanYup'ikZimbabwean
Immigration
NonimmigrantsImmigrantsAfghanistanAfricaAlbaniaArgentinaArmeniaAsiaAustraliaAustriaBahamasBangladeshBarbadosBelarusBelgiumBelizeBoliviaBosnia and HerzegovinaBrazilBulgariaBurma/MyanmarCabo VerdeCambodiaCameroonCanadaCaribbeanCentral AmericaChileChinaColombiaCongoCosta RicaCroatiaCubaCzechoslovakiaDenmarkDominicaDominican RepublicEastern AfricaEastern AsiaEastern EuropeEcuadorEgyptEl SalvadorEnglandEritreaEthiopiaEuropeFijiFranceGermanyGhanaGreeceGrenadaGuatemalaGuyanaHaitiHondurasHong KongHungaryIndiaIndonesiaIranIraqIrelandIsraelItalyJamaicaJapanJordanKazakhstanKenyaKoreaKuwaitLaosLatin AmericaLatviaLebanonLiberiaLithuaniaMalaysiaMexicoMicronesiaMiddle AfricaMoldovaMoroccoNepalNetherlandsNicaraguaNigeriaNorth AmericaNorth MacedoniaNorthern AfricaNorthern EuropeNorwayOceaniaPakistanPanamaPeruPhilippinesPolandPortugalRomaniaRussiaSaudi ArabiaScotlandSenegalSerbiaSierra LeoneSingaporeSomaliaSouth AfricaSouth AmericaSouth Central AsiaSouth Eastern AsiaSouthern EuropeSpainSri LankaSt. Vincent and the GrenadinesSudanSwedenSwitzerlandSyriaTaiwanThailandTrinidad and TobagoTurkeyUgandaUkraineUruguayUzbekistanVenezuelaVietnamWest IndiesWestern AfricaWestern AsiaWestern EuropeYemenZaireZimbabweAzores
Disability Age Under 5
Income
Poverty
Unemployment
Labor Participation
Family Structure
Vehicle Availability
Education Level
Disability

Disability Age Under 5 Comparison

Scandinavians

Immigrants from Western Asia

Tragic
Exceptional
1.5%
DISABILITY AGE UNDER 5
0.0/ 100
METRIC RATING
287th/ 347
METRIC RANK
1.1%
DISABILITY AGE UNDER 5
99.2/ 100
METRIC RATING
60th/ 347
METRIC RANK

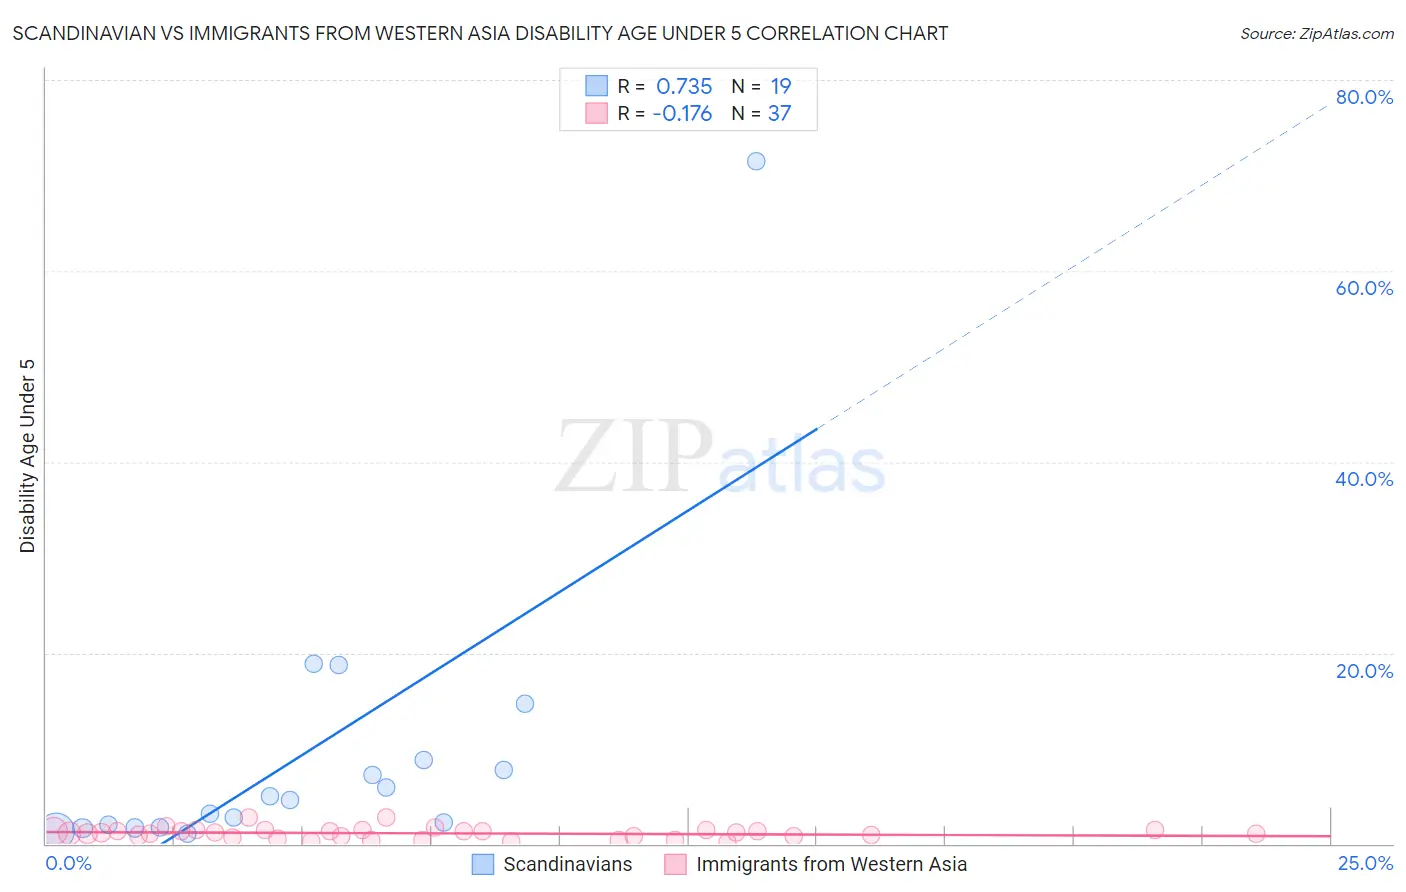
Scandinavian vs Immigrants from Western Asia Disability Age Under 5 Correlation Chart

The statistical analysis conducted on geographies consisting of 234,208,425 people shows a strong positive correlation between the proportion of Scandinavians and percentage of population with a disability under the age of 5 in the United States with a correlation coefficient (R) of 0.735 and weighted average of 1.5%. Similarly, the statistical analysis conducted on geographies consisting of 218,056,003 people shows a poor negative correlation between the proportion of Immigrants from Western Asia and percentage of population with a disability under the age of 5 in the United States with a correlation coefficient (R) of -0.176 and weighted average of 1.1%, a difference of 39.6%.
Scandinavian vs Immigrants from Western Asia Disability Age Under 5

Disability Age Under 5 Correlation Summary

MeasurementScandinavianImmigrants from Western Asia
Minimum1.1%0.20%
Maximum71.4%2.7%
Range70.3%2.5%
Mean9.5%1.1%
Median4.6%1.1%
Interquartile 25% (IQ1)1.7%0.72%
Interquartile 75% (IQ3)8.7%1.4%
Interquartile Range (IQR)7.0%0.63%
Standard Deviation (Sample)16.0%0.57%
Standard Deviation (Population)15.6%0.57%

Similar Demographics by Disability Age Under 5

Demographics Similar to Scandinavians by Disability Age Under 5

In terms of disability age under 5, the demographic groups most similar to Scandinavians are Tlingit-Haida (1.5%, a difference of 0.050%), Estonian (1.5%, a difference of 0.18%), Croatian (1.5%, a difference of 0.30%), Hungarian (1.5%, a difference of 0.32%), and Czech (1.5%, a difference of 0.45%).
DemographicsRating | RankDisability Age Under 5
British
0.0
/100
|
#280
Tragic
1.5%
Czechoslovakians
0.0
/100
|
#281
Tragic
1.5%
Cheyenne
0.0
/100
|
#282
Tragic
1.5%
Delaware
0.0
/100
|
#283
Tragic
1.5%
Europeans
0.0
/100
|
#284
Tragic
1.5%
Croatians
0.0
/100
|
#285
Tragic
1.5%
Tlingit-Haida
0.0
/100
|
#286
Tragic
1.5%
Scandinavians
0.0
/100
|
#287
Tragic
1.5%
Estonians
0.0
/100
|
#288
Tragic
1.5%
Hungarians
0.0
/100
|
#289
Tragic
1.5%
Czechs
0.0
/100
|
#290
Tragic
1.5%
Northern Europeans
0.0
/100
|
#291
Tragic
1.6%
Italians
0.0
/100
|
#292
Tragic
1.6%
Lithuanians
0.0
/100
|
#293
Tragic
1.6%
Swedes
0.0
/100
|
#294
Tragic
1.6%

Demographics Similar to Immigrants from Western Asia by Disability Age Under 5

In terms of disability age under 5, the demographic groups most similar to Immigrants from Western Asia are Immigrants from Ethiopia (1.1%, a difference of 0.060%), Immigrants from Switzerland (1.1%, a difference of 0.070%), Immigrants from Vietnam (1.1%, a difference of 0.18%), Egyptian (1.1%, a difference of 0.64%), and Immigrants from Malaysia (1.1%, a difference of 0.76%).
DemographicsRating | RankDisability Age Under 5
Asians
99.6
/100
|
#53
Exceptional
1.1%
Immigrants | El Salvador
99.6
/100
|
#54
Exceptional
1.1%
Salvadorans
99.5
/100
|
#55
Exceptional
1.1%
Ecuadorians
99.5
/100
|
#56
Exceptional
1.1%
Assyrians/Chaldeans/Syriacs
99.5
/100
|
#57
Exceptional
1.1%
Immigrants | Egypt
99.4
/100
|
#58
Exceptional
1.1%
Immigrants | Malaysia
99.4
/100
|
#59
Exceptional
1.1%
Immigrants | Western Asia
99.2
/100
|
#60
Exceptional
1.1%
Immigrants | Ethiopia
99.2
/100
|
#61
Exceptional
1.1%
Immigrants | Switzerland
99.2
/100
|
#62
Exceptional
1.1%
Immigrants | Vietnam
99.1
/100
|
#63
Exceptional
1.1%
Egyptians
98.9
/100
|
#64
Exceptional
1.1%
Immigrants | Korea
98.8
/100
|
#65
Exceptional
1.1%
Immigrants | Indonesia
98.7
/100
|
#66
Exceptional
1.1%
Immigrants | Belize
98.7
/100
|
#67
Exceptional
1.1%