Scandinavian vs Immigrants from Zaire Disability Age Under 5
COMPARE
Scandinavian
Immigrants from Zaire
Disability Age Under 5
Disability Age Under 5 Comparison
Scandinavians
Immigrants from Zaire
1.5%
DISABILITY AGE UNDER 5
0.0/ 100
METRIC RATING
287th/ 347
METRIC RANK
1.1%
DISABILITY AGE UNDER 5
97.8/ 100
METRIC RATING
84th/ 347
METRIC RANK
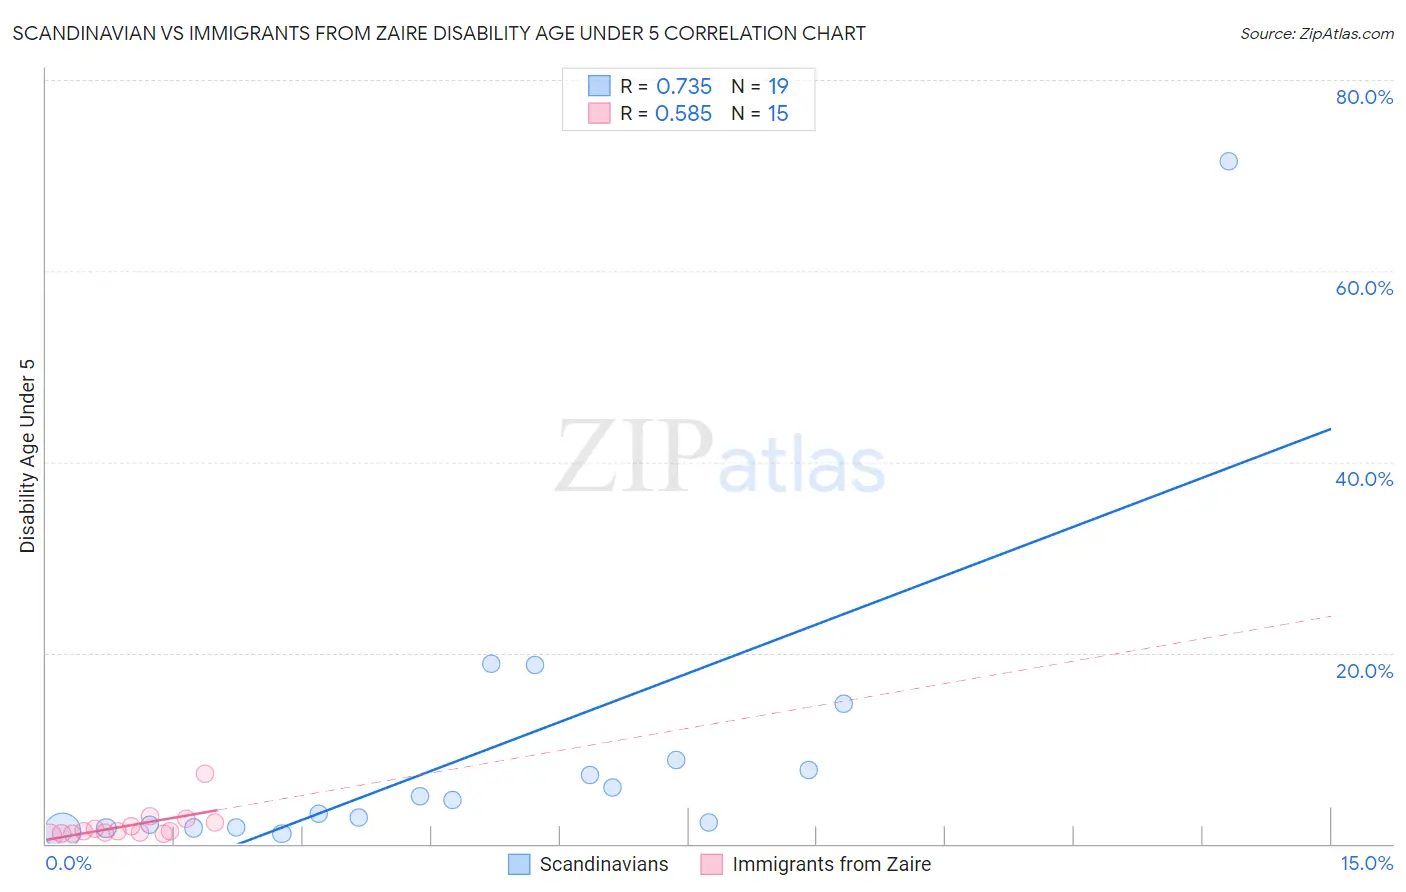
Scandinavian vs Immigrants from Zaire Disability Age Under 5 Correlation Chart
The statistical analysis conducted on geographies consisting of 234,208,425 people shows a strong positive correlation between the proportion of Scandinavians and percentage of population with a disability under the age of 5 in the United States with a correlation coefficient (R) of 0.735 and weighted average of 1.5%. Similarly, the statistical analysis conducted on geographies consisting of 82,804,930 people shows a substantial positive correlation between the proportion of Immigrants from Zaire and percentage of population with a disability under the age of 5 in the United States with a correlation coefficient (R) of 0.585 and weighted average of 1.1%, a difference of 36.1%.
Disability Age Under 5 Correlation Summary
| Measurement | Scandinavian | Immigrants from Zaire |
| Minimum | 1.1% | 0.85% |
| Maximum | 71.4% | 7.4% |
| Range | 70.3% | 6.5% |
| Mean | 9.5% | 1.9% |
| Median | 4.6% | 1.3% |
| Interquartile 25% (IQ1) | 1.7% | 1.1% |
| Interquartile 75% (IQ3) | 8.7% | 2.3% |
| Interquartile Range (IQR) | 7.0% | 1.2% |
| Standard Deviation (Sample) | 16.0% | 1.6% |
| Standard Deviation (Population) | 15.6% | 1.6% |
Similar Demographics by Disability Age Under 5
Demographics Similar to Scandinavians by Disability Age Under 5
In terms of disability age under 5, the demographic groups most similar to Scandinavians are Tlingit-Haida (1.5%, a difference of 0.050%), Estonian (1.5%, a difference of 0.18%), Croatian (1.5%, a difference of 0.30%), Hungarian (1.5%, a difference of 0.32%), and Czech (1.5%, a difference of 0.45%).
| Demographics | Rating | Rank | Disability Age Under 5 |
| British | 0.0 /100 | #280 | Tragic 1.5% |
| Czechoslovakians | 0.0 /100 | #281 | Tragic 1.5% |
| Cheyenne | 0.0 /100 | #282 | Tragic 1.5% |
| Delaware | 0.0 /100 | #283 | Tragic 1.5% |
| Europeans | 0.0 /100 | #284 | Tragic 1.5% |
| Croatians | 0.0 /100 | #285 | Tragic 1.5% |
| Tlingit-Haida | 0.0 /100 | #286 | Tragic 1.5% |
| Scandinavians | 0.0 /100 | #287 | Tragic 1.5% |
| Estonians | 0.0 /100 | #288 | Tragic 1.5% |
| Hungarians | 0.0 /100 | #289 | Tragic 1.5% |
| Czechs | 0.0 /100 | #290 | Tragic 1.5% |
| Northern Europeans | 0.0 /100 | #291 | Tragic 1.6% |
| Italians | 0.0 /100 | #292 | Tragic 1.6% |
| Lithuanians | 0.0 /100 | #293 | Tragic 1.6% |
| Swedes | 0.0 /100 | #294 | Tragic 1.6% |
Demographics Similar to Immigrants from Zaire by Disability Age Under 5
In terms of disability age under 5, the demographic groups most similar to Immigrants from Zaire are Sudanese (1.1%, a difference of 0.080%), Immigrants from Syria (1.1%, a difference of 0.15%), Immigrants from Jordan (1.1%, a difference of 0.16%), Okinawan (1.1%, a difference of 0.20%), and Ugandan (1.1%, a difference of 0.22%).
| Demographics | Rating | Rank | Disability Age Under 5 |
| Immigrants | Denmark | 98.1 /100 | #77 | Exceptional 1.1% |
| West Indians | 98.0 /100 | #78 | Exceptional 1.1% |
| Hmong | 98.0 /100 | #79 | Exceptional 1.1% |
| Immigrants | Trinidad and Tobago | 98.0 /100 | #80 | Exceptional 1.1% |
| Turks | 98.0 /100 | #81 | Exceptional 1.1% |
| Immigrants | Jordan | 97.9 /100 | #82 | Exceptional 1.1% |
| Immigrants | Syria | 97.9 /100 | #83 | Exceptional 1.1% |
| Immigrants | Zaire | 97.8 /100 | #84 | Exceptional 1.1% |
| Sudanese | 97.7 /100 | #85 | Exceptional 1.1% |
| Okinawans | 97.6 /100 | #86 | Exceptional 1.1% |
| Ugandans | 97.5 /100 | #87 | Exceptional 1.1% |
| Immigrants | Dominican Republic | 97.5 /100 | #88 | Exceptional 1.1% |
| Ethiopians | 97.2 /100 | #89 | Exceptional 1.1% |
| Chinese | 97.2 /100 | #90 | Exceptional 1.1% |
| Albanians | 97.2 /100 | #91 | Exceptional 1.1% |