Zip Codes with the Most Immigrants from Burma / Myanmar in California
RELATED REPORTS & OPTIONS
Burma / Myanmar
California
Compare Zip Codes
Map of Zip Codes with the Most Immigrants from Burma / Myanmar in California
0
2,000
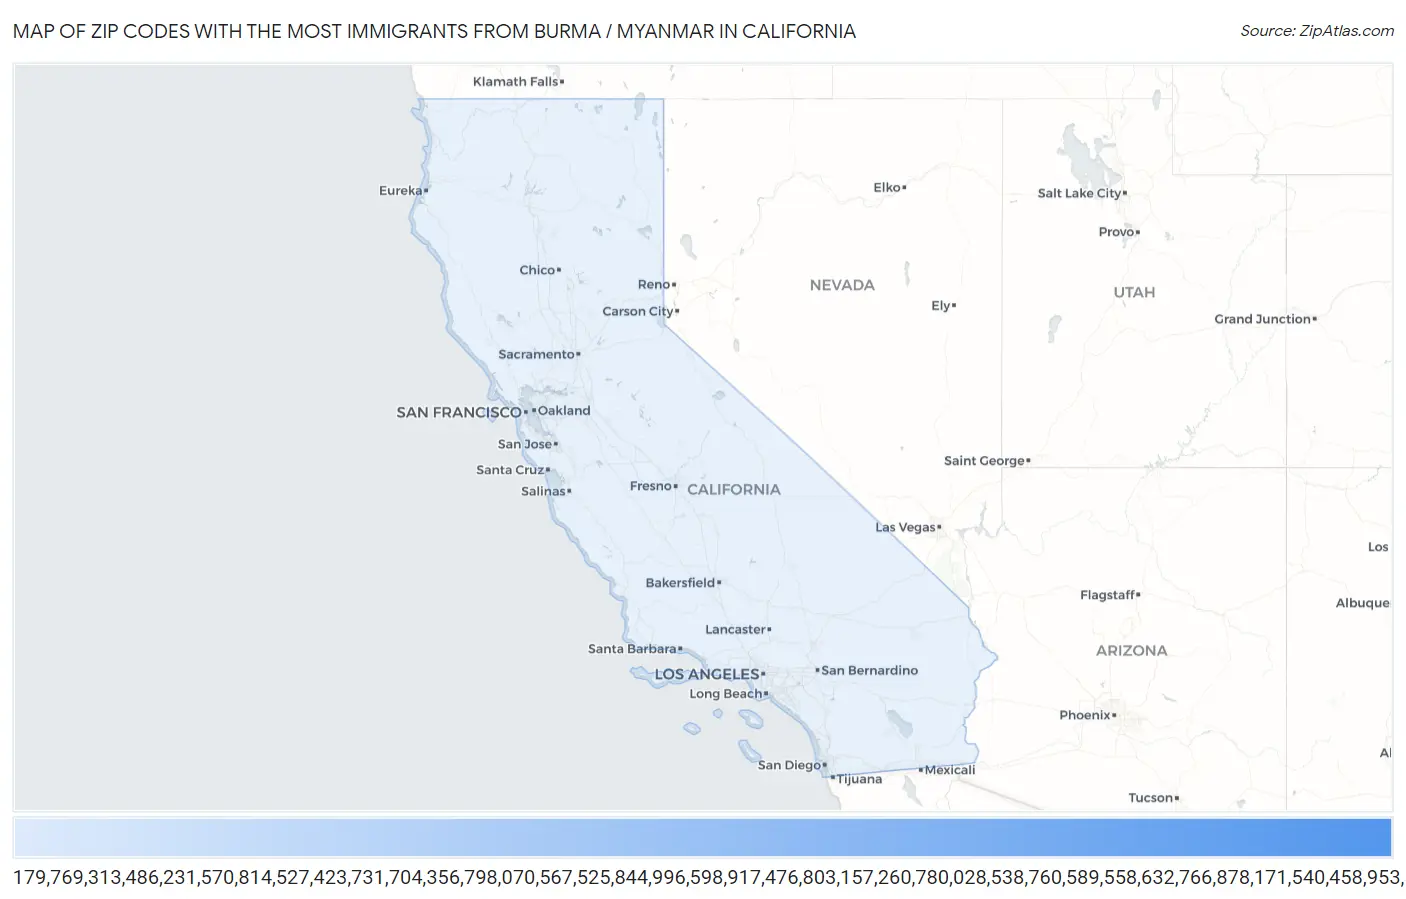
Zip Codes with the Most Immigrants from Burma / Myanmar in California
| Zip Code | Burma / Myanmar | vs State | vs National | |
| 1. | 94015 | 1,788 | 28,176 (6.35%)#-1 | 157,000 (1.14%)#0 |
| 2. | 91770 | 959 | 28,176 (3.40%)#0 | 157,000 (0.61%)#1 |
| 3. | 94538 | 944 | 28,176 (3.35%)#1 | 157,000 (0.60%)#2 |
| 4. | 94122 | 600 | 28,176 (2.13%)#2 | 157,000 (0.38%)#3 |
| 5. | 94536 | 558 | 28,176 (1.98%)#3 | 157,000 (0.36%)#4 |
| 6. | 94112 | 542 | 28,176 (1.92%)#4 | 157,000 (0.35%)#5 |
| 7. | 90505 | 538 | 28,176 (1.91%)#5 | 157,000 (0.34%)#6 |
| 8. | 94080 | 463 | 28,176 (1.64%)#6 | 157,000 (0.29%)#7 |
| 9. | 94132 | 448 | 28,176 (1.59%)#7 | 157,000 (0.29%)#8 |
| 10. | 94587 | 444 | 28,176 (1.58%)#8 | 157,000 (0.28%)#9 |
| 11. | 91706 | 419 | 28,176 (1.49%)#9 | 157,000 (0.27%)#10 |
| 12. | 94116 | 409 | 28,176 (1.45%)#10 | 157,000 (0.26%)#11 |
| 13. | 91776 | 376 | 28,176 (1.33%)#11 | 157,000 (0.24%)#12 |
| 14. | 91006 | 371 | 28,176 (1.32%)#12 | 157,000 (0.24%)#13 |
| 15. | 94014 | 354 | 28,176 (1.26%)#13 | 157,000 (0.23%)#14 |
| 16. | 91765 | 348 | 28,176 (1.24%)#14 | 157,000 (0.22%)#15 |
| 17. | 91754 | 290 | 28,176 (1.03%)#15 | 157,000 (0.18%)#16 |
| 18. | 94555 | 283 | 28,176 (1.00%)#16 | 157,000 (0.18%)#17 |
| 19. | 91801 | 278 | 28,176 (0.99%)#17 | 157,000 (0.18%)#18 |
| 20. | 91755 | 276 | 28,176 (0.98%)#18 | 157,000 (0.18%)#19 |
| 21. | 95035 | 266 | 28,176 (0.94%)#19 | 157,000 (0.17%)#20 |
| 22. | 91790 | 260 | 28,176 (0.92%)#20 | 157,000 (0.17%)#21 |
| 23. | 91791 | 250 | 28,176 (0.89%)#21 | 157,000 (0.16%)#22 |
| 24. | 94403 | 241 | 28,176 (0.86%)#22 | 157,000 (0.15%)#23 |
| 25. | 94109 | 237 | 28,176 (0.84%)#23 | 157,000 (0.15%)#24 |
| 26. | 91007 | 236 | 28,176 (0.84%)#24 | 157,000 (0.15%)#25 |
| 27. | 91732 | 228 | 28,176 (0.81%)#25 | 157,000 (0.15%)#26 |
| 28. | 91803 | 226 | 28,176 (0.80%)#26 | 157,000 (0.14%)#27 |
| 29. | 94544 | 220 | 28,176 (0.78%)#27 | 157,000 (0.14%)#28 |
| 30. | 95822 | 206 | 28,176 (0.73%)#28 | 157,000 (0.13%)#29 |
| 31. | 90031 | 203 | 28,176 (0.72%)#29 | 157,000 (0.13%)#30 |
| 32. | 92115 | 190 | 28,176 (0.67%)#30 | 157,000 (0.12%)#31 |
| 33. | 93065 | 188 | 28,176 (0.67%)#31 | 157,000 (0.12%)#32 |
| 34. | 94134 | 174 | 28,176 (0.62%)#32 | 157,000 (0.11%)#33 |
| 35. | 90232 | 174 | 28,176 (0.62%)#33 | 157,000 (0.11%)#34 |
| 36. | 91748 | 173 | 28,176 (0.61%)#34 | 157,000 (0.11%)#35 |
| 37. | 91775 | 173 | 28,176 (0.61%)#35 | 157,000 (0.11%)#36 |
| 38. | 90260 | 172 | 28,176 (0.61%)#36 | 157,000 (0.11%)#37 |
| 39. | 90640 | 164 | 28,176 (0.58%)#37 | 157,000 (0.10%)#38 |
| 40. | 91789 | 160 | 28,176 (0.57%)#38 | 157,000 (0.10%)#39 |
| 41. | 94044 | 160 | 28,176 (0.57%)#39 | 157,000 (0.10%)#40 |
| 42. | 95330 | 156 | 28,176 (0.55%)#40 | 157,000 (0.10%)#41 |
| 43. | 95219 | 154 | 28,176 (0.55%)#41 | 157,000 (0.10%)#42 |
| 44. | 91786 | 153 | 28,176 (0.54%)#42 | 157,000 (0.10%)#43 |
| 45. | 94118 | 153 | 28,176 (0.54%)#43 | 157,000 (0.10%)#44 |
| 46. | 94577 | 149 | 28,176 (0.53%)#44 | 157,000 (0.09%)#45 |
| 47. | 94030 | 147 | 28,176 (0.52%)#45 | 157,000 (0.09%)#46 |
| 48. | 95758 | 145 | 28,176 (0.51%)#46 | 157,000 (0.09%)#47 |
| 49. | 95148 | 145 | 28,176 (0.51%)#47 | 157,000 (0.09%)#48 |
| 50. | 95823 | 140 | 28,176 (0.50%)#48 | 157,000 (0.09%)#49 |
| 51. | 92105 | 139 | 28,176 (0.49%)#49 | 157,000 (0.09%)#50 |
| 52. | 93726 | 138 | 28,176 (0.49%)#50 | 157,000 (0.09%)#51 |
| 53. | 91780 | 137 | 28,176 (0.49%)#51 | 157,000 (0.09%)#52 |
| 54. | 95051 | 132 | 28,176 (0.47%)#52 | 157,000 (0.08%)#53 |
| 55. | 90631 | 131 | 28,176 (0.46%)#53 | 157,000 (0.08%)#54 |
| 56. | 91709 | 130 | 28,176 (0.46%)#54 | 157,000 (0.08%)#55 |
| 57. | 94601 | 124 | 28,176 (0.44%)#55 | 157,000 (0.08%)#56 |
| 58. | 94010 | 124 | 28,176 (0.44%)#56 | 157,000 (0.08%)#57 |
| 59. | 94124 | 123 | 28,176 (0.44%)#57 | 157,000 (0.08%)#58 |
| 60. | 94063 | 117 | 28,176 (0.42%)#58 | 157,000 (0.07%)#59 |
| 61. | 95128 | 116 | 28,176 (0.41%)#59 | 157,000 (0.07%)#60 |
| 62. | 91764 | 115 | 28,176 (0.41%)#60 | 157,000 (0.07%)#61 |
| 63. | 91745 | 105 | 28,176 (0.37%)#61 | 157,000 (0.07%)#62 |
| 64. | 94531 | 103 | 28,176 (0.37%)#62 | 157,000 (0.07%)#63 |
| 65. | 91722 | 102 | 28,176 (0.36%)#63 | 157,000 (0.06%)#64 |
| 66. | 94552 | 98 | 28,176 (0.35%)#64 | 157,000 (0.06%)#65 |
| 67. | 91731 | 97 | 28,176 (0.34%)#65 | 157,000 (0.06%)#66 |
| 68. | 95127 | 95 | 28,176 (0.34%)#66 | 157,000 (0.06%)#67 |
| 69. | 91723 | 95 | 28,176 (0.34%)#67 | 157,000 (0.06%)#68 |
| 70. | 92505 | 93 | 28,176 (0.33%)#68 | 157,000 (0.06%)#69 |
| 71. | 94550 | 90 | 28,176 (0.32%)#69 | 157,000 (0.06%)#70 |
| 72. | 95111 | 88 | 28,176 (0.31%)#70 | 157,000 (0.06%)#71 |
| 73. | 90034 | 87 | 28,176 (0.31%)#71 | 157,000 (0.06%)#72 |
| 74. | 95132 | 87 | 28,176 (0.31%)#72 | 157,000 (0.06%)#73 |
| 75. | 91724 | 87 | 28,176 (0.31%)#73 | 157,000 (0.06%)#74 |
| 76. | 94110 | 82 | 28,176 (0.29%)#74 | 157,000 (0.05%)#75 |
| 77. | 90033 | 82 | 28,176 (0.29%)#75 | 157,000 (0.05%)#76 |
| 78. | 92782 | 82 | 28,176 (0.29%)#76 | 157,000 (0.05%)#77 |
| 79. | 94582 | 81 | 28,176 (0.29%)#77 | 157,000 (0.05%)#78 |
| 80. | 95014 | 80 | 28,176 (0.28%)#78 | 157,000 (0.05%)#79 |
| 81. | 95131 | 78 | 28,176 (0.28%)#79 | 157,000 (0.05%)#80 |
| 82. | 94602 | 78 | 28,176 (0.28%)#80 | 157,000 (0.05%)#81 |
| 83. | 93309 | 77 | 28,176 (0.27%)#81 | 157,000 (0.05%)#82 |
| 84. | 94121 | 77 | 28,176 (0.27%)#82 | 157,000 (0.05%)#83 |
| 85. | 91604 | 75 | 28,176 (0.27%)#83 | 157,000 (0.05%)#84 |
| 86. | 94089 | 75 | 28,176 (0.27%)#84 | 157,000 (0.05%)#85 |
| 87. | 94066 | 73 | 28,176 (0.26%)#85 | 157,000 (0.05%)#86 |
| 88. | 95133 | 72 | 28,176 (0.26%)#86 | 157,000 (0.05%)#87 |
| 89. | 95834 | 70 | 28,176 (0.25%)#87 | 157,000 (0.04%)#88 |
| 90. | 95661 | 70 | 28,176 (0.25%)#88 | 157,000 (0.04%)#89 |
| 91. | 95008 | 69 | 28,176 (0.24%)#89 | 157,000 (0.04%)#90 |
| 92. | 90278 | 69 | 28,176 (0.24%)#90 | 157,000 (0.04%)#91 |
| 93. | 95121 | 68 | 28,176 (0.24%)#91 | 157,000 (0.04%)#92 |
| 94. | 94087 | 66 | 28,176 (0.23%)#92 | 157,000 (0.04%)#93 |
| 95. | 90020 | 66 | 28,176 (0.23%)#93 | 157,000 (0.04%)#94 |
| 96. | 90012 | 65 | 28,176 (0.23%)#94 | 157,000 (0.04%)#95 |
| 97. | 91913 | 64 | 28,176 (0.23%)#95 | 157,000 (0.04%)#96 |
| 98. | 94115 | 64 | 28,176 (0.23%)#96 | 157,000 (0.04%)#97 |
| 99. | 92129 | 63 | 28,176 (0.22%)#97 | 157,000 (0.04%)#98 |
| 100. | 94539 | 62 | 28,176 (0.22%)#98 | 157,000 (0.04%)#99 |
Common Questions
What are the Top 10 Zip Codes with the Most Immigrants from Burma / Myanmar in California?
Top 10 Zip Codes with the Most Immigrants from Burma / Myanmar in California are:
What zip code has the Most Immigrants from Burma / Myanmar in California?
94015 has the Most Immigrants from Burma / Myanmar in California with 1,788.
What is the Total Immigrants from Burma / Myanmar in the State of California?
Total Immigrants from Burma / Myanmar in California is 28,176.
What is the Total Immigrants from Burma / Myanmar in the United States?
Total Immigrants from Burma / Myanmar in the United States is 157,000.