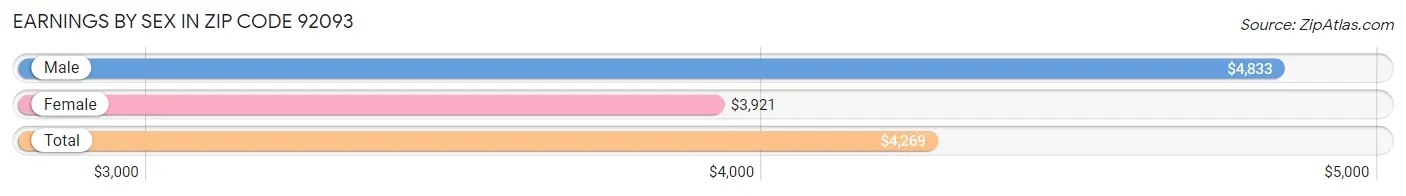
Average Earnings in Zip Code 92093 are $4,269, $4,833 for men and $3,921 for women, a difference of 18.9%.
Sex
Number
Average Earnings
Male
604 (43.2%)
$4,833
Female
794 (56.8%)
$3,921
Total
1,398 (100.0%)
$4,269
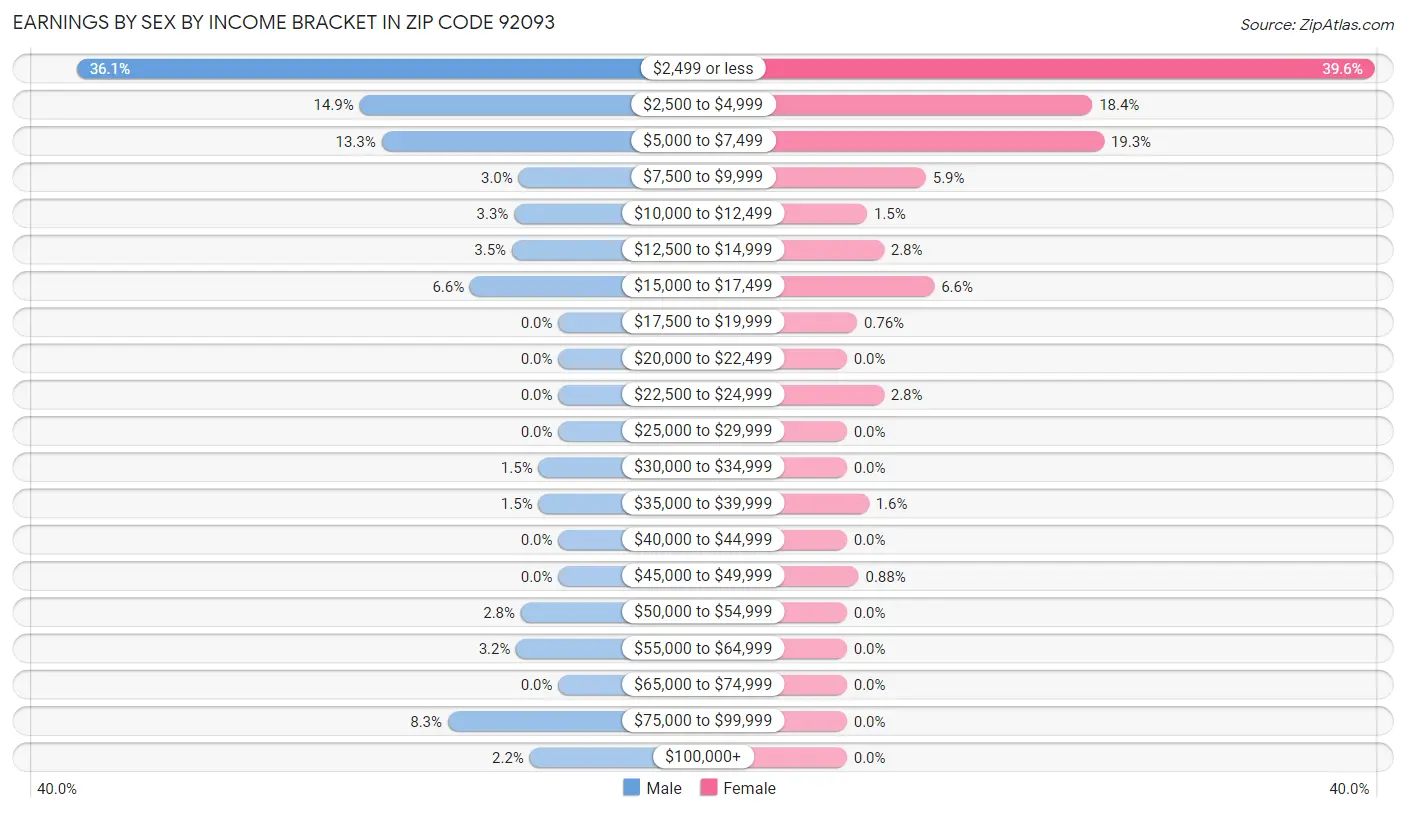
Earnings by Sex by Income Bracket in Zip Code 92093
The most common earnings brackets in Zip Code 92093 are $2,499 or less for men (218 | 36.1%) and $2,499 or less for women (314 | 39.6%).
Income
Male
Female
$2,499 or less
218 (36.1%)
314 (39.6%)
$2,500 to $4,999
90 (14.9%)
146 (18.4%)
$5,000 to $7,499
80 (13.3%)
153 (19.3%)
$7,500 to $9,999
18 (3.0%)
47 (5.9%)
$10,000 to $12,499
20 (3.3%)
12 (1.5%)
$12,500 to $14,999
21 (3.5%)
22 (2.8%)
$15,000 to $17,499
40 (6.6%)
52 (6.6%)
$17,500 to $19,999
0 (0.0%)
6 (0.8%)
$20,000 to $22,499
0 (0.0%)
0 (0.0%)
$22,500 to $24,999
0 (0.0%)
22 (2.8%)
$25,000 to $29,999
0 (0.0%)
0 (0.0%)
$30,000 to $34,999
9 (1.5%)
0 (0.0%)
$35,000 to $39,999
9 (1.5%)
13 (1.6%)
$40,000 to $44,999
0 (0.0%)
0 (0.0%)
$45,000 to $49,999
0 (0.0%)
7 (0.9%)
$50,000 to $54,999
17 (2.8%)
0 (0.0%)
$55,000 to $64,999
19 (3.2%)
0 (0.0%)
$65,000 to $74,999
0 (0.0%)
0 (0.0%)
$75,000 to $99,999
50 (8.3%)
0 (0.0%)
$100,000+
13 (2.1%)
0 (0.0%)
Total
604 (100.0%)
794 (100.0%)
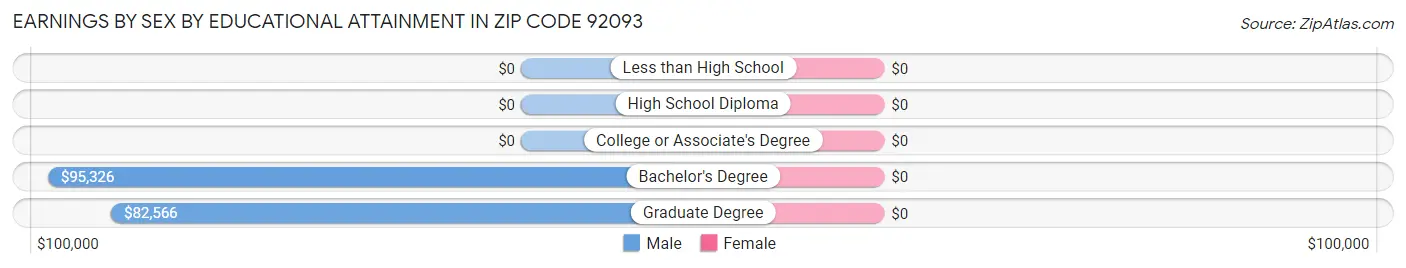
Earnings by Sex by Educational Attainment in Zip Code 92093
Educational Attainment
Male Income
Female Income
Less than High School
-
-
High School Diploma
-
-
College or Associate's Degree
-
-
Bachelor's Degree
$95,326
$0
Graduate Degree
$82,566
$0
Total
$83,565
$0
Family Income in Zip Code 92093
Family Income Brackets in Zip Code 92093
Income Bracket
# Families
% Families
Less than $10,000
0
0.0%
$10,000 to $14,999
0
0.0%
$15,000 to $24,999
0
0.0%
$25,000 to $34,999
0
0.0%
$35,000 to $49,999
0
0.0%
$50,000 to $74,999
0
0.0%
$75,000 to $99,999
0
0.0%
$100,000 to $149,999
0
0.0%
$150,000 to $199,999
0
0.0%
$200,000+
0
0.0%
Family Income by Famaliy Size in Zip Code 92093
Income Bracket
# Families
Median Income
2-Person Families
0 (0.0%)
$0
3-Person Families
0 (0.0%)
$0
4-Person Families
0 (0.0%)
$0
5-Person Families
0 (0.0%)
$0
6-Person Families
0 (0.0%)
$0
7+ Person Families
0 (0.0%)
$0
Total
0 (0.0%)
$0
Family Income by Number of Earners in Zip Code 92093
Number of Earners
# Families
Median Income
No Earners
0 (0.0%)
$0
1 Earner
0 (0.0%)
$0
2 Earners
0 (0.0%)
$0
3+ Earners
0 (0.0%)
$0
Total
0 (0.0%)
$0
Household Income in Zip Code 92093
Household Income Brackets in Zip Code 92093
Income Bracket
# Households
% Households
Less than $10,000
0
0.0%
$10,000 to $14,999
0
0.0%
$15,000 to $24,999
0
0.0%
$25,000 to $34,999
0
0.0%
$35,000 to $49,999
0
0.0%
$50,000 to $74,999
0
0.0%
$75,000 to $99,999
0
0.0%
$100,000 to $149,999
0
0.0%
$150,000 to $199,999
0
0.0%
$200,000+
0
0.0%
Household Income by Householder Age in Zip Code 92093
Income Bracket
# Households
Median Income
15 to 24 Years
0 (0.0%)
$0
25 to 44 Years
0 (0.0%)
$0
45 to 64 Years
0 (0.0%)
$0
65+ Years
0 (0.0%)
$0
Total
0 (0.0%)
$0
Poverty in Zip Code 92093
Income Below Poverty by Sex and Age in Zip Code 92093
Age Bracket
Male
Female
Under 5 Years
0 (0.0%)
0 (0.0%)
5 Years
0 (0.0%)
0 (0.0%)
6 to 11 Years
0 (0.0%)
0 (0.0%)
12 to 14 Years
0 (0.0%)
0 (0.0%)
15 Years
0 (0.0%)
0 (0.0%)
16 and 17 Years
0 (0.0%)
0 (0.0%)
18 to 24 Years
0 (0.0%)
0 (0.0%)
25 to 34 Years
0 (0.0%)
0 (0.0%)
35 to 44 Years
0 (0.0%)
0 (0.0%)
45 to 54 Years
0 (0.0%)
0 (0.0%)
55 to 64 Years
0 (0.0%)
0 (0.0%)
65 to 74 Years
0 (0.0%)
0 (0.0%)
75 Years and over
0 (0.0%)
0 (0.0%)
Total
0 (0.0%)
0 (0.0%)
Income Above Poverty by Sex and Age in Zip Code 92093
Age Bracket
Male
Female
Under 5 Years
0 (0.0%)
0 (0.0%)
5 Years
0 (0.0%)
0 (0.0%)
6 to 11 Years
0 (0.0%)
0 (0.0%)
12 to 14 Years
0 (0.0%)
0 (0.0%)
15 Years
0 (0.0%)
0 (0.0%)
16 and 17 Years
0 (0.0%)
0 (0.0%)
18 to 24 Years
0 (0.0%)
0 (0.0%)
25 to 34 Years
0 (0.0%)
0 (0.0%)
35 to 44 Years
0 (0.0%)
0 (0.0%)
45 to 54 Years
0 (0.0%)
0 (0.0%)
55 to 64 Years
0 (0.0%)
0 (0.0%)
65 to 74 Years
0 (0.0%)
0 (0.0%)
75 Years and over
0 (0.0%)
0 (0.0%)
Total
0 (0.0%)
0 (0.0%)
Income Below Poverty Among Married-Couple Families in Zip Code 92093
Children
Above Poverty
Below Poverty
No Children
0 (0.0%)
0 (0.0%)
1 or 2 Children
0 (0.0%)
0 (0.0%)
3 or 4 Children
0 (0.0%)
0 (0.0%)
5 or more Children
0 (0.0%)
0 (0.0%)
Total
0 (0.0%)
0 (0.0%)
Income Below Poverty Among Single-Parent Households in Zip Code 92093
Children
Single Father
Single Mother
No Children
0 (0.0%)
0 (0.0%)
1 or 2 Children
0 (0.0%)
0 (0.0%)
3 or 4 Children
0 (0.0%)
0 (0.0%)
5 or more Children
0 (0.0%)
0 (0.0%)
Total
0 (0.0%)
0 (0.0%)
Income Below Poverty Among Married-Couple vs Single-Parent Households in Zip Code 92093
Children
Married-Couple Families
Single-Parent Households
No Children
0 (0.0%)
0 (0.0%)
1 or 2 Children
0 (0.0%)
0 (0.0%)
3 or 4 Children
0 (0.0%)
0 (0.0%)
5 or more Children
0 (0.0%)
0 (0.0%)
Total
0 (0.0%)
0 (0.0%)
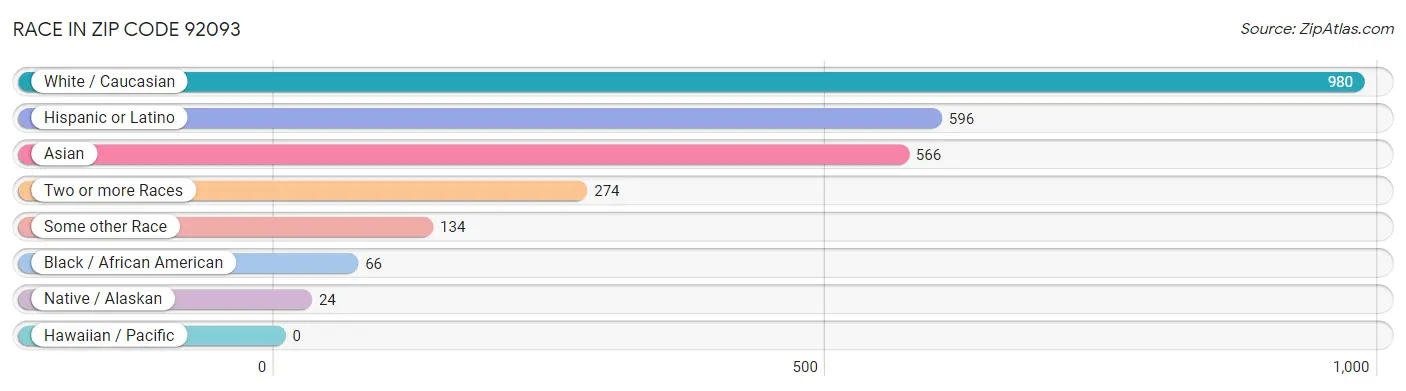
Race in Zip Code 92093
The most populous races in Zip Code 92093 are White / Caucasian (980 | 47.9%), Hispanic or Latino (596 | 29.2%), and Asian (566 | 27.7%).
Race
# Population
% Population
Asian
566
27.7%
Black / African American
66
3.2%
Hawaiian / Pacific
0
0.0%
Hispanic or Latino
596
29.2%
Native / Alaskan
24
1.2%
White / Caucasian
980
47.9%
Two or more Races
274
13.4%
Some other Race
134
6.6%
Total
2,044
100.0%
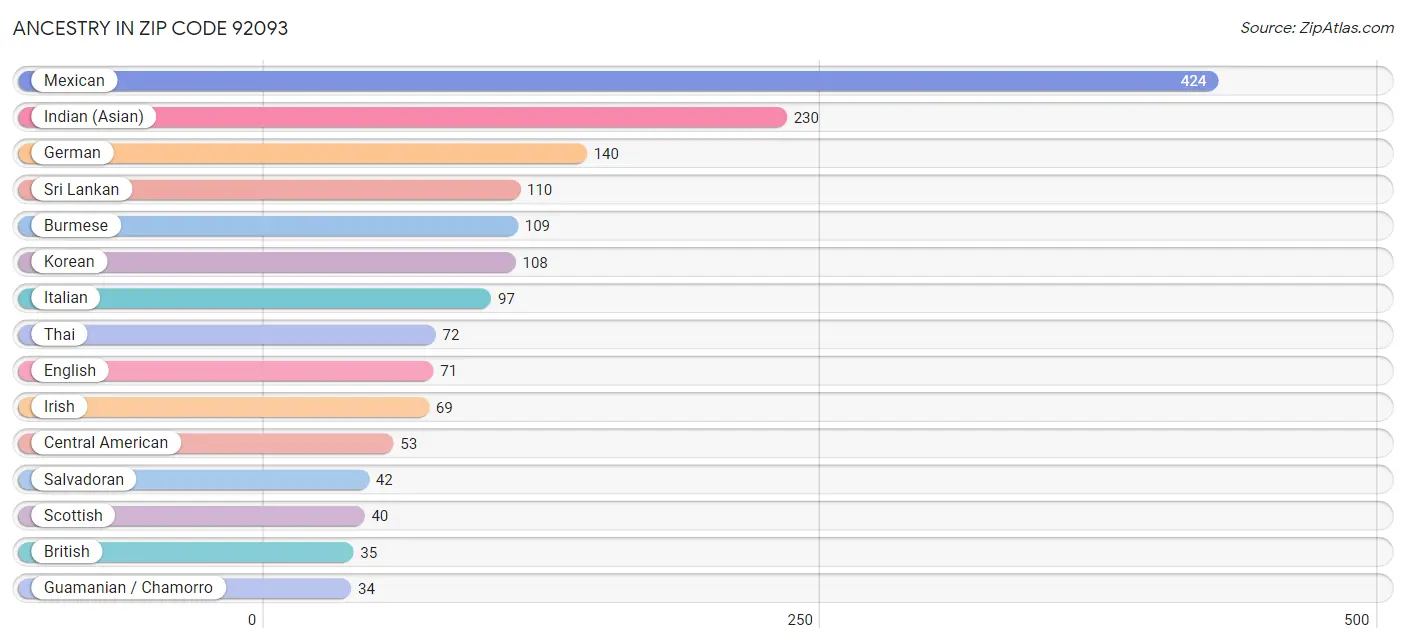
Ancestry in Zip Code 92093
The most populous ancestries reported in Zip Code 92093 are Mexican (424 | 20.7%), Indian (Asian) (230 | 11.3%), German (140 | 6.9%), Sri Lankan (110 | 5.4%), and Burmese (109 | 5.3%), together accounting for 49.6% of all Zip Code 92093 residents.
Ancestry
# Population
% Population
African
1
0.1%
American
32
1.6%
Arab
11
0.5%
Argentinean
11
0.5%
Armenian
6
0.3%
Assyrian / Chaldean / Syriac
1
0.1%
Australian
13
0.6%
Bhutanese
27
1.3%
British
35
1.7%
Burmese
109
5.3%
Canadian
9
0.4%
Central American
53
2.6%
Colombian
10
0.5%
Creek
7
0.3%
Cuban
23
1.1%
Dutch
2
0.1%
Eastern European
33
1.6%
English
71
3.5%
European
8
0.4%
Filipino
32
1.6%
French
27
1.3%
French Canadian
21
1.0%
German
140
6.9%
Greek
11
0.5%
Guamanian / Chamorro
34
1.7%
Guatemalan
6
0.3%
Honduran
5
0.2%
Indian (Asian)
230
11.3%
Iranian
6
0.3%
Irish
69
3.4%
Israeli
9
0.4%
Italian
97
4.8%
Korean
108
5.3%
Lebanese
11
0.5%
Mexican
424
20.7%
Native Hawaiian
10
0.5%
Northern European
6
0.3%
Norwegian
10
0.5%
Pakistani
11
0.5%
Peruvian
12
0.6%
Polish
24
1.2%
Portuguese
11
0.5%
Russian
28
1.4%
Salvadoran
42
2.1%
Scottish
40
2.0%
South American
33
1.6%
Spaniard
11
0.5%
Sri Lankan
110
5.4%
Subsaharan African
1
0.1%
Swedish
32
1.6%
Thai
72
3.5%
View All 51 Rows
Immigrants in Zip Code 92093
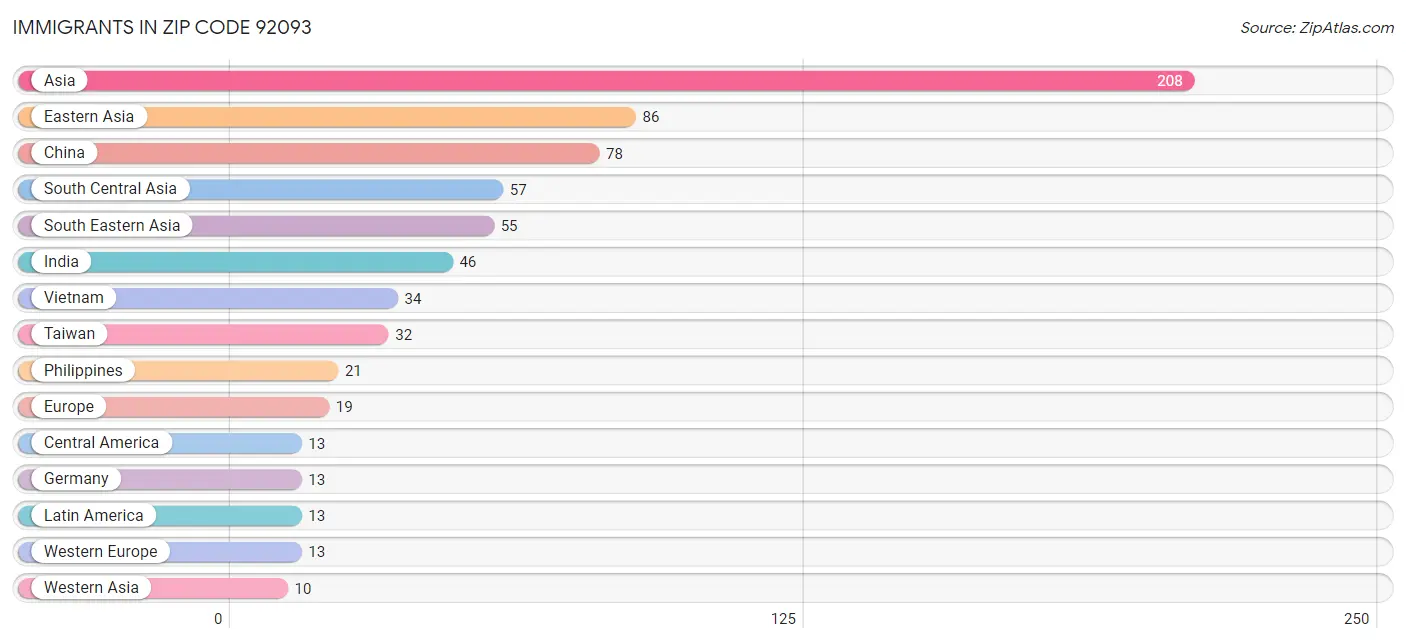
The most numerous immigrant groups reported in Zip Code 92093 came from Asia (208 | 10.2%), Eastern Asia (86 | 4.2%), China (78 | 3.8%), South Central Asia (57 | 2.8%), and South Eastern Asia (55 | 2.7%), together accounting for 23.7% of all Zip Code 92093 residents.
Immigration Origin
# Population
% Population
Asia
208
10.2%
Belize
6
0.3%
Central America
13
0.6%
China
78
3.8%
Eastern Asia
86
4.2%
Eastern Europe
6
0.3%
El Salvador
6
0.3%
Europe
19
0.9%
Germany
13
0.6%
India
46
2.2%
Iraq
1
0.1%
Israel
9
0.4%
Korea
8
0.4%
Latin America
13
0.6%
Mexico
1
0.1%
Philippines
21
1.0%
Russia
6
0.3%
South Central Asia
57
2.8%
South Eastern Asia
55
2.7%
Taiwan
32
1.6%
Vietnam
34
1.7%
Western Asia
10
0.5%
Western Europe
13
0.6%
View All 23 Rows
Sex and Age in Zip Code 92093
Sex and Age in Zip Code 92093
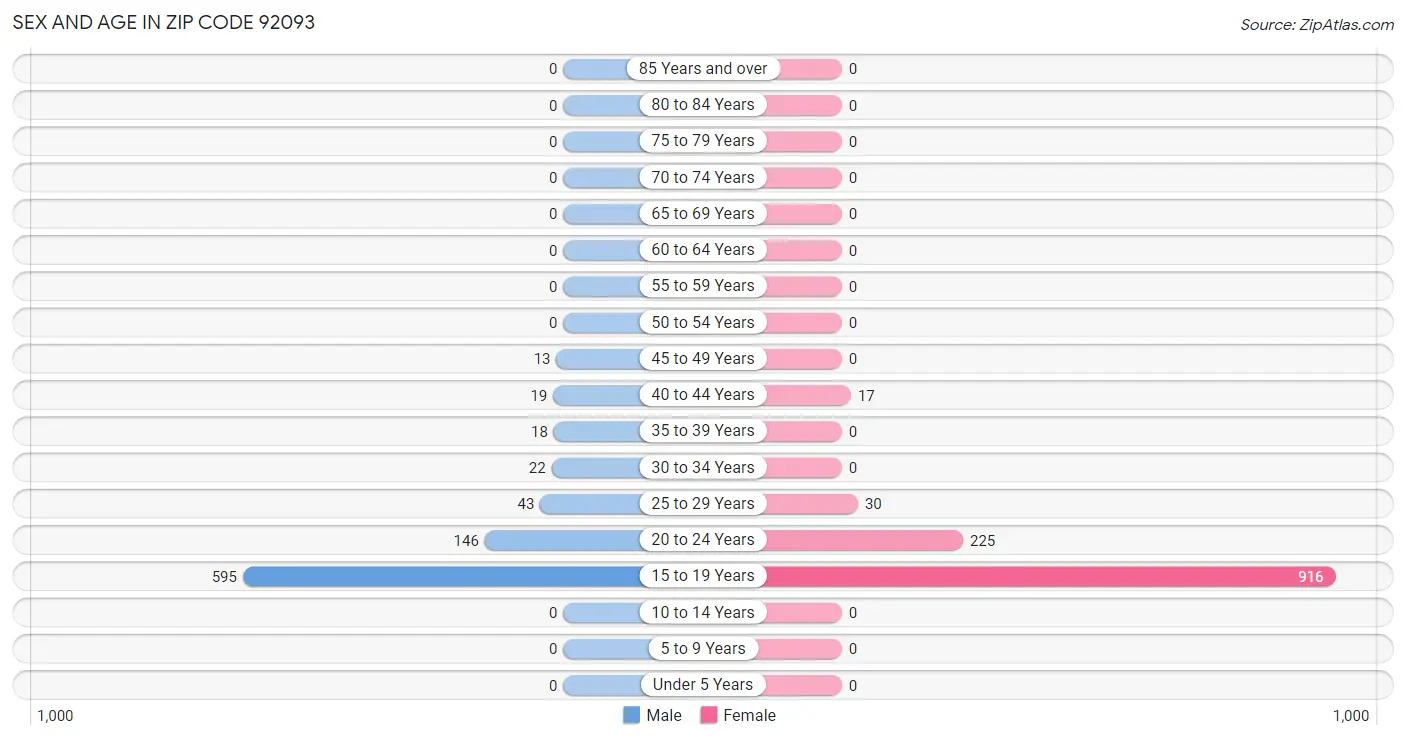
The most populous age groups in Zip Code 92093 are 15 to 19 Years (595 | 69.5%) for men and 15 to 19 Years (916 | 77.1%) for women.
Age Bracket
Male
Female
Under 5 Years
0 (0.0%)
0 (0.0%)
5 to 9 Years
0 (0.0%)
0 (0.0%)
10 to 14 Years
0 (0.0%)
0 (0.0%)
15 to 19 Years
595 (69.5%)
916 (77.1%)
20 to 24 Years
146 (17.1%)
225 (18.9%)
25 to 29 Years
43 (5.0%)
30 (2.5%)
30 to 34 Years
22 (2.6%)
0 (0.0%)
35 to 39 Years
18 (2.1%)
0 (0.0%)
40 to 44 Years
19 (2.2%)
17 (1.4%)
45 to 49 Years
13 (1.5%)
0 (0.0%)
50 to 54 Years
0 (0.0%)
0 (0.0%)
55 to 59 Years
0 (0.0%)
0 (0.0%)
60 to 64 Years
0 (0.0%)
0 (0.0%)
65 to 69 Years
0 (0.0%)
0 (0.0%)
70 to 74 Years
0 (0.0%)
0 (0.0%)
75 to 79 Years
0 (0.0%)
0 (0.0%)
80 to 84 Years
0 (0.0%)
0 (0.0%)
85 Years and over
0 (0.0%)
0 (0.0%)
Total
856 (100.0%)
1,188 (100.0%)
Families and Households in Zip Code 92093
Median Family Size in Zip Code 92093
Family Type
# Families
Family Size
Married-Couple
0 (0.0%)
-
Single Male/Father
0 (0.0%)
-
Single Female/Mother
0 (0.0%)
-
Total Families
0 (0.0%)
-
Median Household Size in Zip Code 92093
Household Type
# Households
Household Size
Married-Couple
0 (0.0%)
-
Single Male/Father
0 (0.0%)
-
Single Female/Mother
0 (0.0%)
-
Non-family
0 (0.0%)
-
Total Households
0 (0.0%)
-
Household Size by Marriage Status in Zip Code 92093
Household Size
Family Households
Nonfamily Households
1-Person Households
-
0 (0.0%)
2-Person Households
0 (0.0%)
0 (0.0%)
3-Person Households
0 (0.0%)
0 (0.0%)
4-Person Households
0 (0.0%)
0 (0.0%)
5-Person Households
0 (0.0%)
0 (0.0%)
6-Person Households
0 (0.0%)
0 (0.0%)
7+ Person Households
0 (0.0%)
0 (0.0%)
Total
0 (0.0%)
0 (0.0%)
Female Fertility in Zip Code 92093
Fertility by Age in Zip Code 92093
Age Bracket
Women with Births
Births / 1,000 Women
15 to 19 years
0 (0.0%)
0.0
20 to 34 years
0 (0.0%)
0.0
35 to 50 years
0 (0.0%)
0.0
Total
0 (0.0%)
0.0
Fertility by Age by Marriage Status in Zip Code 92093
Age Bracket
Married
Unmarried
15 to 19 years
0 (0.0%)
0 (0.0%)
20 to 34 years
0 (0.0%)
0 (0.0%)
35 to 50 years
0 (0.0%)
0 (0.0%)
Total
0 (0.0%)
0 (0.0%)
Fertility by Education in Zip Code 92093
Educational Attainment
Women with Births
Births / 1,000 Women
Less than High School
0 (0.0%)
0.0
High School Diploma
0 (0.0%)
0.0
College or Associate's Degree
0 (0.0%)
0.0
Bachelor's Degree
0 (0.0%)
0.0
Graduate Degree
0 (0.0%)
0.0
Total
0 (0.0%)
0.0
Fertility by Education by Marriage Status in Zip Code 92093
Educational Attainment
Married
Unmarried
Less than High School
0 (0.0%)
0 (0.0%)
High School Diploma
0 (0.0%)
0 (0.0%)
College or Associate's Degree
0 (0.0%)
0 (0.0%)
Bachelor's Degree
0 (0.0%)
0 (0.0%)
Graduate Degree
0 (0.0%)
0 (0.0%)
Total
0 (0.0%)
0 (0.0%)
Employment Characteristics in Zip Code 92093
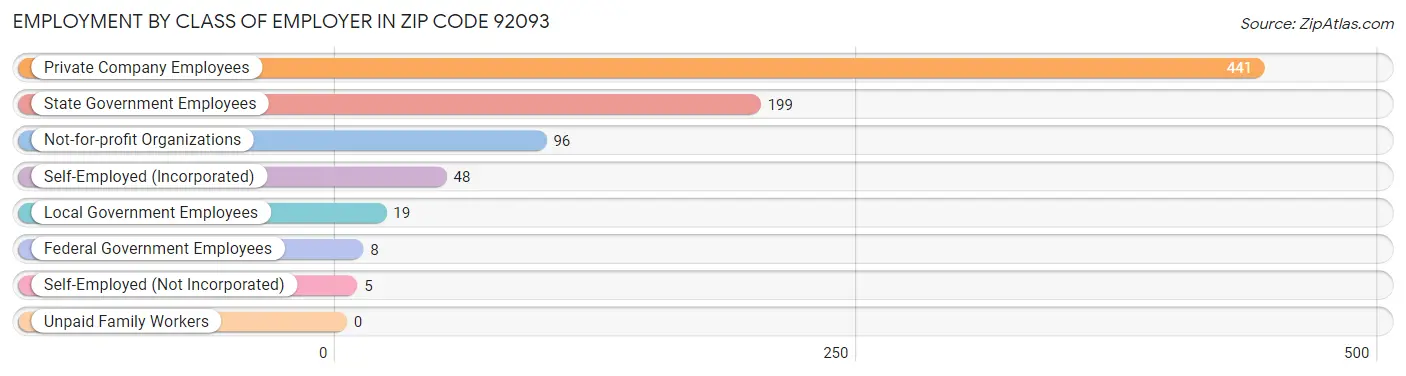
Employment by Class of Employer in Zip Code 92093
Among the 816 employed individuals in Zip Code 92093, private company employees (441 | 54.0%), state government employees (199 | 24.4%), and not-for-profit organizations (96 | 11.8%) make up the most common classes of employment.
Employer Class
# Employees
% Employees
Private Company Employees
441
54.0%
Self-Employed (Incorporated)
48
5.9%
Self-Employed (Not Incorporated)
5
0.6%
Not-for-profit Organizations
96
11.8%
Local Government Employees
19
2.3%
State Government Employees
199
24.4%
Federal Government Employees
8
1.0%
Unpaid Family Workers
0
0.0%
Total
816
100.0%
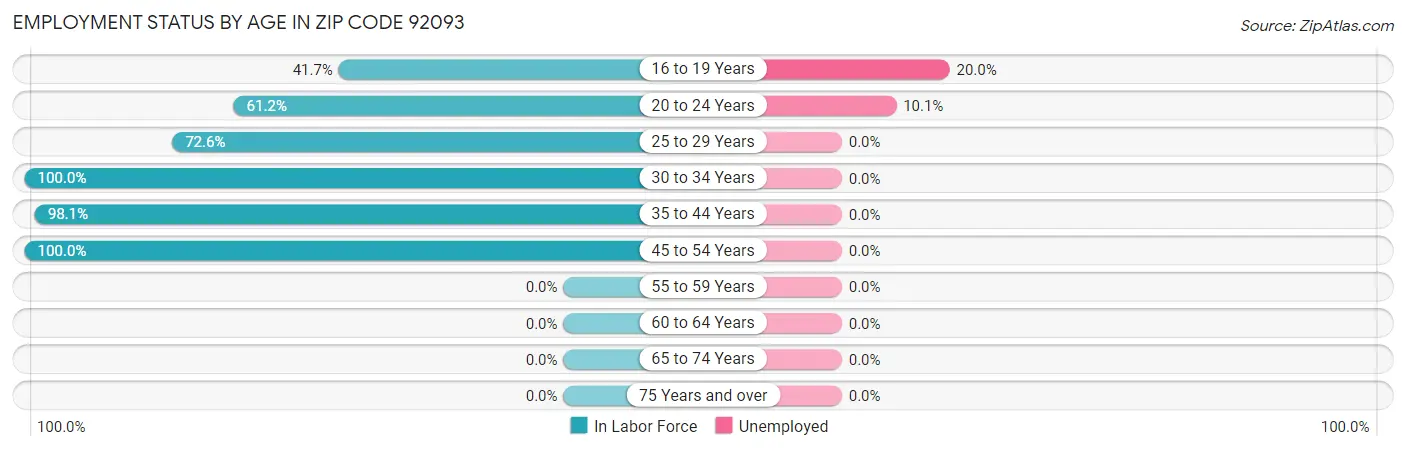
Employment Status by Age in Zip Code 92093
According to the labor force statistics for Zip Code 92093, out of the total population over 16 years of age (2,044), 48.8% or 997 individuals are in the labor force, with 14.9% or 149 of them unemployed. The age group with the highest labor force participation rate is 30 to 34 years, with 100.0% or 22 individuals in the labor force. Within the labor force, the 16 to 19 years age range has the highest percentage of unemployed individuals, with 20.0% or 126 of them being unemployed.
Age Bracket
In Labor Force
Unemployed
16 to 19 Years
630 (41.7%)
126 (20.0%)
20 to 24 Years
227 (61.2%)
23 (10.1%)
25 to 29 Years
53 (72.6%)
0 (0.0%)
30 to 34 Years
22 (100.0%)
0 (0.0%)
35 to 44 Years
53 (98.1%)
0 (0.0%)
45 to 54 Years
13 (100.0%)
0 (0.0%)
55 to 59 Years
0 (0.0%)
0 (0.0%)
60 to 64 Years
0 (0.0%)
0 (0.0%)
65 to 74 Years
0 (0.0%)
0 (0.0%)
75 Years and over
0 (0.0%)
0 (0.0%)
Total
997 (48.8%)
149 (14.9%)
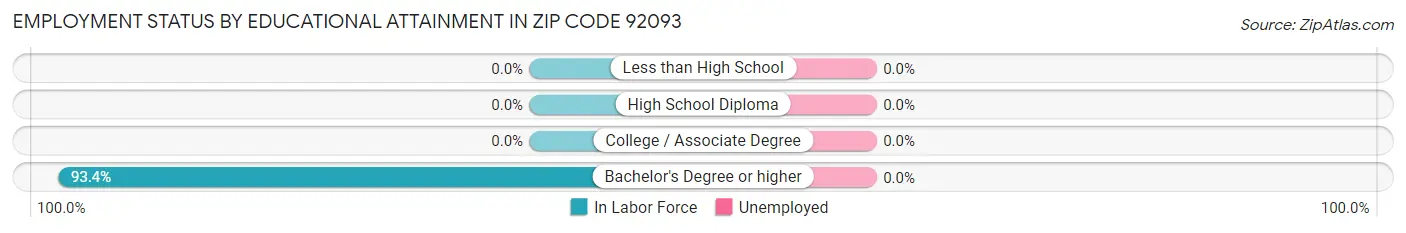
Employment Status by Educational Attainment in Zip Code 92093
Educational Attainment
In Labor Force
Unemployed
Less than High School
0 (0.0%)
0 (0.0%)
High School Diploma
0 (0.0%)
0 (0.0%)
College / Associate Degree
0 (0.0%)
0 (0.0%)
Bachelor's Degree or higher
141 (93.4%)
0 (0.0%)
Total
141 (87.0%)
0 (0.0%)
Employment Occupations by Sex in Zip Code 92093
Management, Business, Science and Arts Occupations
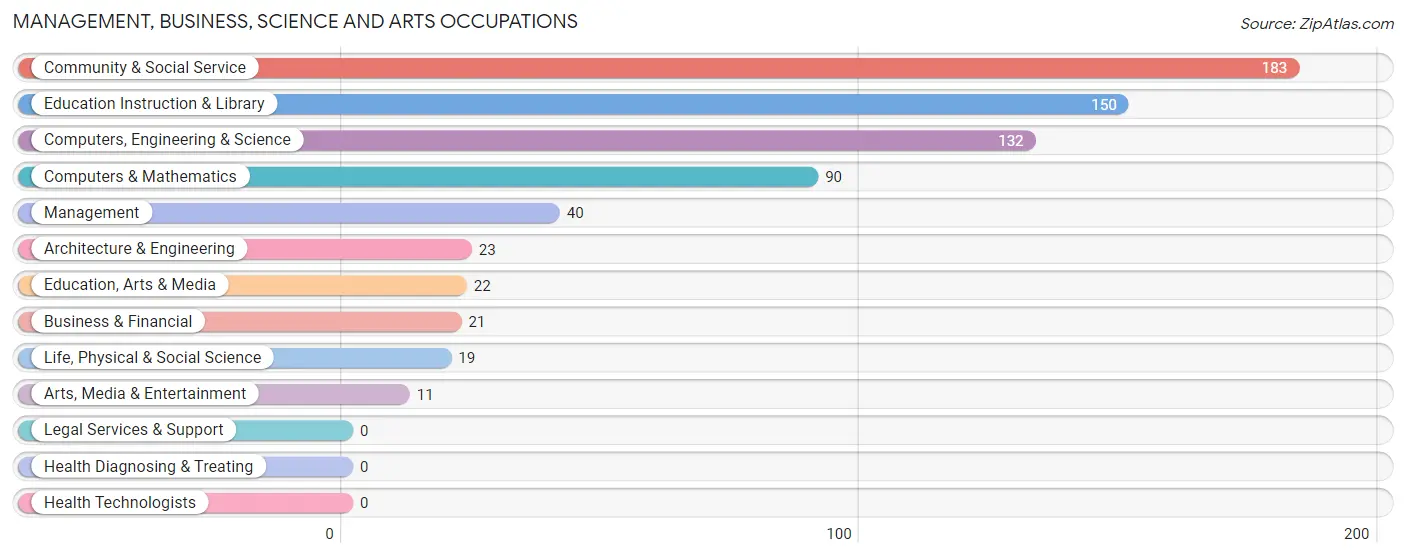
The most common Management, Business, Science and Arts occupations in Zip Code 92093 are Community & Social Service (183 | 21.5%), Education Instruction & Library (150 | 17.7%), Computers, Engineering & Science (132 | 15.5%), Computers & Mathematics (90 | 10.6%), and Management (40 | 4.7%).
Management, Business, Science and Arts Occupations by Sex
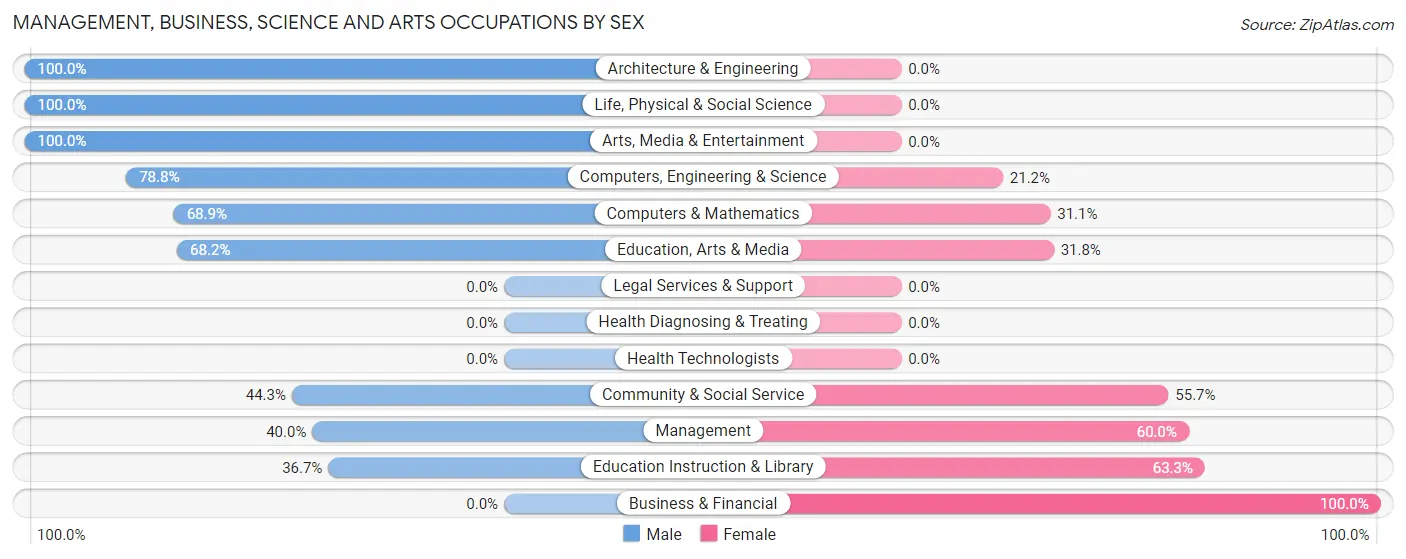
Within the Management, Business, Science and Arts occupations in Zip Code 92093, the most male-oriented occupations are Architecture & Engineering (100.0%), Life, Physical & Social Science (100.0%), and Arts, Media & Entertainment (100.0%), while the most female-oriented occupations are Business & Financial (100.0%), Education Instruction & Library (63.3%), and Management (60.0%).
Occupation
Male
Female
Management
16 (40.0%)
24 (60.0%)
Business & Financial
0 (0.0%)
21 (100.0%)
Computers, Engineering & Science
104 (78.8%)
28 (21.2%)
Computers & Mathematics
62 (68.9%)
28 (31.1%)
Architecture & Engineering
23 (100.0%)
0 (0.0%)
Life, Physical & Social Science
19 (100.0%)
0 (0.0%)
Community & Social Service
81 (44.3%)
102 (55.7%)
Education, Arts & Media
15 (68.2%)
7 (31.8%)
Legal Services & Support
0 (0.0%)
0 (0.0%)
Education Instruction & Library
55 (36.7%)
95 (63.3%)
Arts, Media & Entertainment
11 (100.0%)
0 (0.0%)
Health Diagnosing & Treating
0 (0.0%)
0 (0.0%)
Health Technologists
0 (0.0%)
0 (0.0%)
Total (Category)
201 (53.5%)
175 (46.5%)
Total (Overall)
312 (36.7%)
537 (63.2%)
Services Occupations
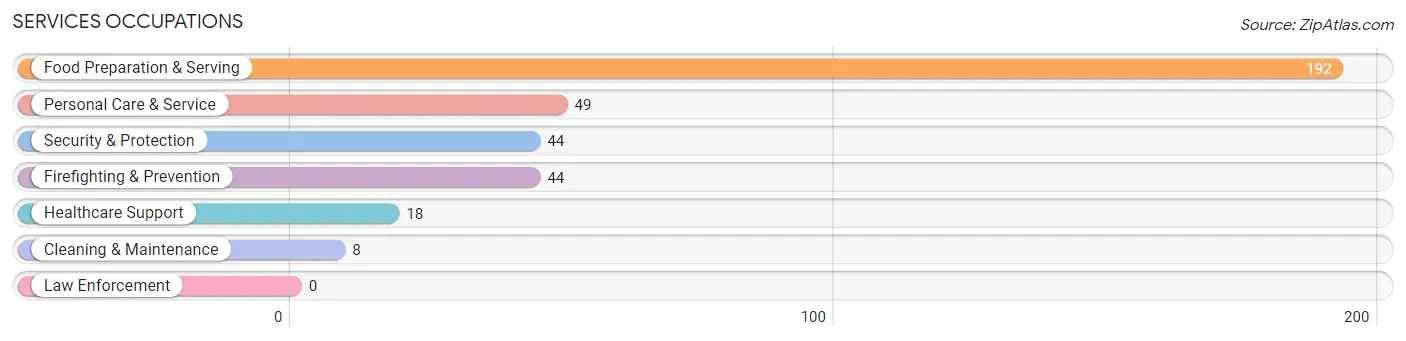
The most common Services occupations in Zip Code 92093 are Food Preparation & Serving (192 | 22.6%), Personal Care & Service (49 | 5.8%), Security & Protection (44 | 5.2%), Firefighting & Prevention (44 | 5.2%), and Healthcare Support (18 | 2.1%).
Services Occupations by Sex
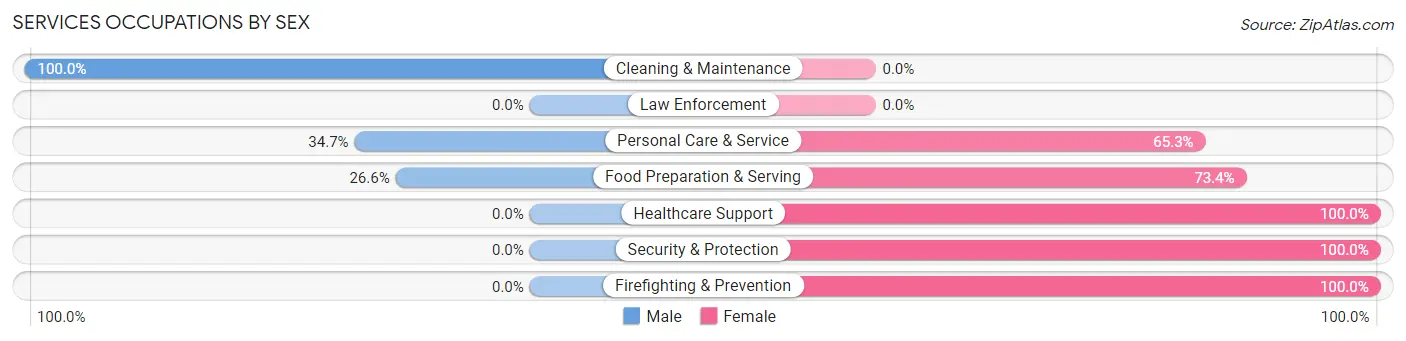
Within the Services occupations in Zip Code 92093, the most male-oriented occupations are Cleaning & Maintenance (100.0%), Personal Care & Service (34.7%), and Food Preparation & Serving (26.6%), while the most female-oriented occupations are Healthcare Support (100.0%), Security & Protection (100.0%), and Firefighting & Prevention (100.0%).
Occupation
Male
Female
Healthcare Support
0 (0.0%)
18 (100.0%)
Security & Protection
0 (0.0%)
44 (100.0%)
Firefighting & Prevention
0 (0.0%)
44 (100.0%)
Law Enforcement
0 (0.0%)
0 (0.0%)
Food Preparation & Serving
51 (26.6%)
141 (73.4%)
Cleaning & Maintenance
8 (100.0%)
0 (0.0%)
Personal Care & Service
17 (34.7%)
32 (65.3%)
Total (Category)
76 (24.4%)
235 (75.6%)
Total (Overall)
312 (36.7%)
537 (63.2%)
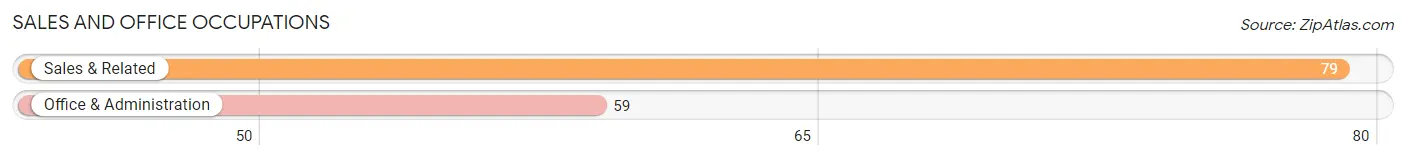
Sales and Office Occupations
The most common Sales and Office occupations in Zip Code 92093 are Sales & Related (79 | 9.3%), and Office & Administration (59 | 7.0%).
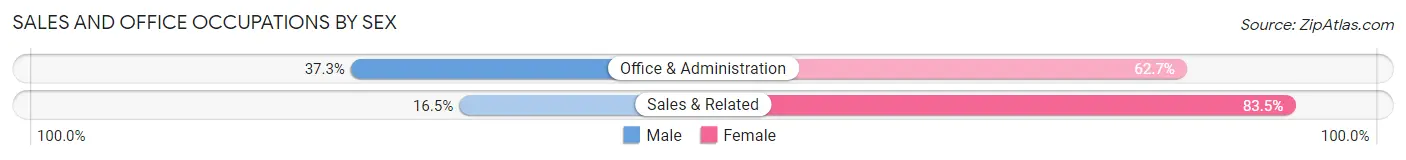
Sales and Office Occupations by Sex
Occupation
Male
Female
Sales & Related
13 (16.5%)
66 (83.5%)
Office & Administration
22 (37.3%)
37 (62.7%)
Total (Category)
35 (25.4%)
103 (74.6%)
Total (Overall)
312 (36.7%)
537 (63.2%)
Natural Resources, Construction and Maintenance Occupations
Natural Resources, Construction and Maintenance Occupations by Sex
Occupation
Male
Female
Farming, Fishing & Forestry
0 (0.0%)
0 (0.0%)
Construction & Extraction
0 (0.0%)
0 (0.0%)
Installation, Maintenance & Repair
0 (0.0%)
0 (0.0%)
Total (Category)
0 (0.0%)
0 (0.0%)
Total (Overall)
312 (36.7%)
537 (63.2%)
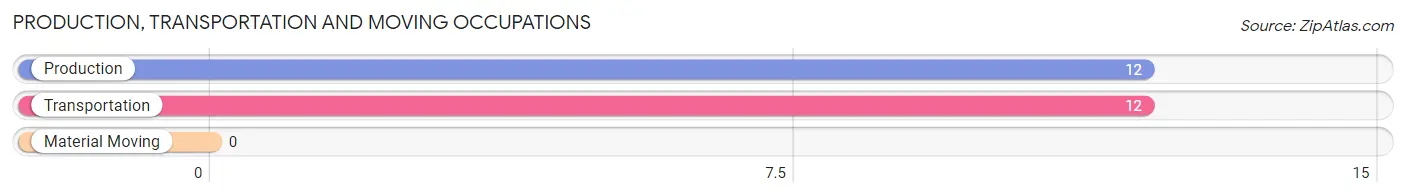
Production, Transportation and Moving Occupations
The most common Production, Transportation and Moving occupations in Zip Code 92093 are Production (12 | 1.4%), and Transportation (12 | 1.4%).
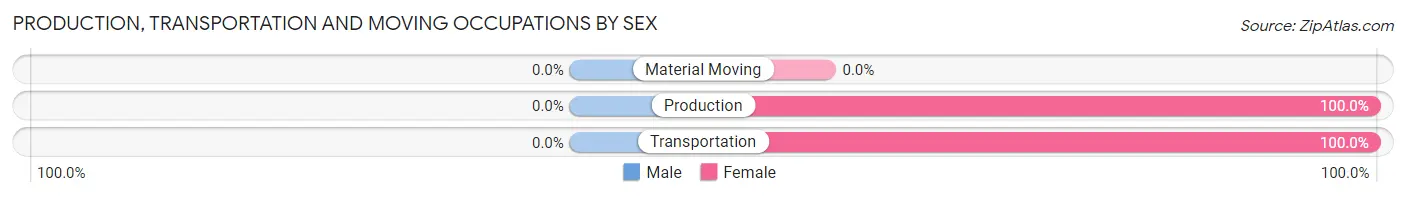
Production, Transportation and Moving Occupations by Sex
Occupation
Male
Female
Production
0 (0.0%)
12 (100.0%)
Transportation
0 (0.0%)
12 (100.0%)
Material Moving
0 (0.0%)
0 (0.0%)
Total (Category)
0 (0.0%)
24 (100.0%)
Total (Overall)
312 (36.7%)
537 (63.2%)
Employment Industries by Sex in Zip Code 92093
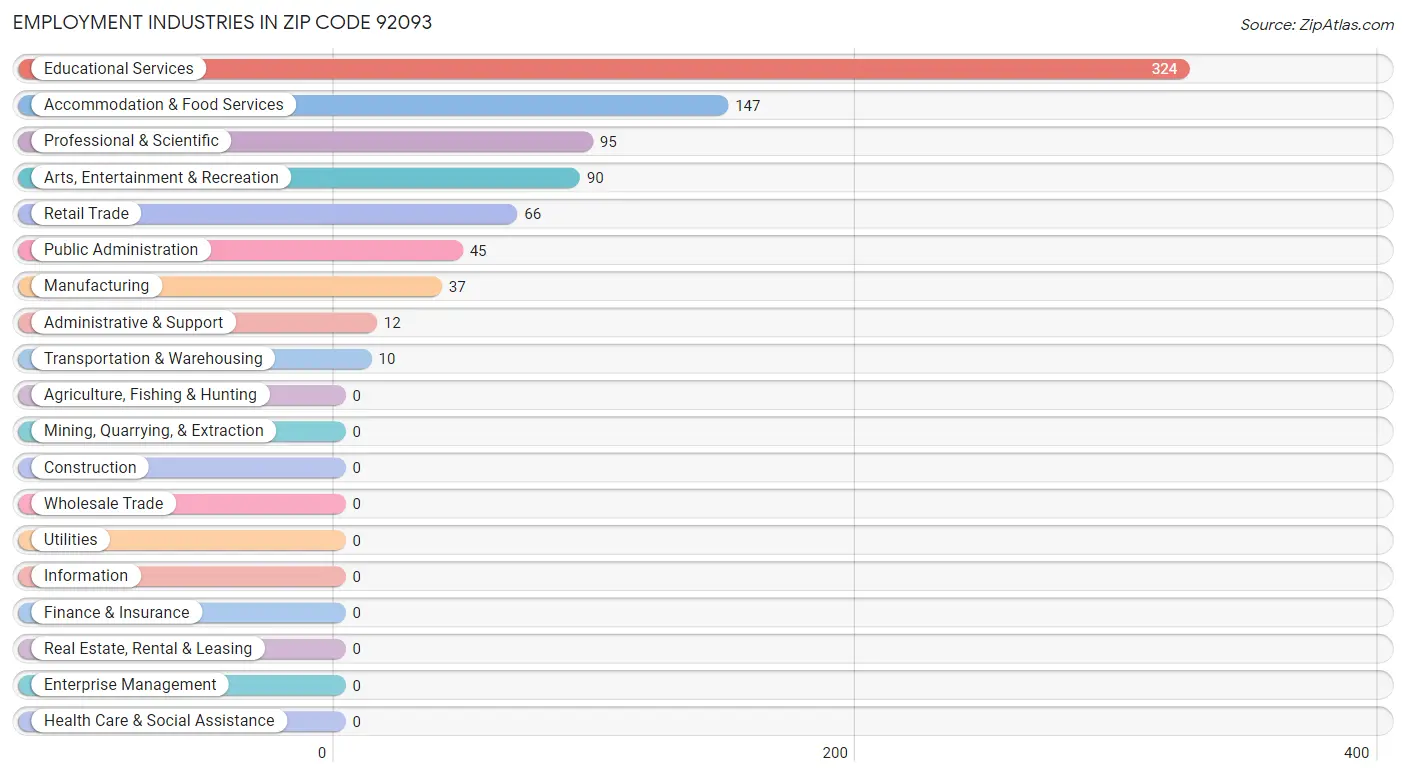
Employment Industries in Zip Code 92093
The major employment industries in Zip Code 92093 include Educational Services (324 | 38.2%), Accommodation & Food Services (147 | 17.3%), Professional & Scientific (95 | 11.2%), Arts, Entertainment & Recreation (90 | 10.6%), and Retail Trade (66 | 7.8%).
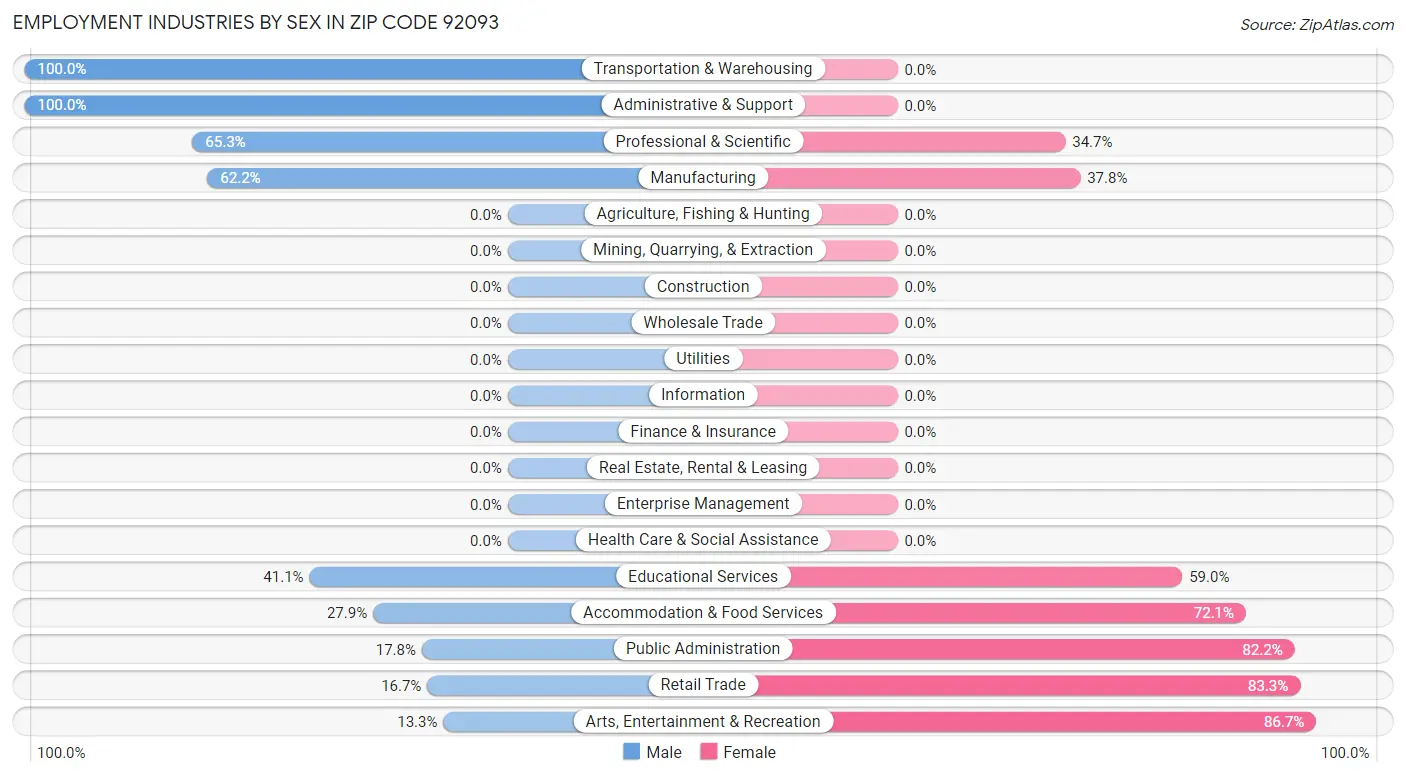
Employment Industries by Sex in Zip Code 92093
The Zip Code 92093 industries that see more men than women are Transportation & Warehousing (100.0%), Administrative & Support (100.0%), and Professional & Scientific (65.3%), whereas the industries that tend to have a higher number of women are Arts, Entertainment & Recreation (86.7%), Retail Trade (83.3%), and Public Administration (82.2%).
Industry
Male
Female
Agriculture, Fishing & Hunting
0 (0.0%)
0 (0.0%)
Mining, Quarrying, & Extraction
0 (0.0%)
0 (0.0%)
Construction
0 (0.0%)
0 (0.0%)
Manufacturing
23 (62.2%)
14 (37.8%)
Wholesale Trade
0 (0.0%)
0 (0.0%)
Retail Trade
11 (16.7%)
55 (83.3%)
Transportation & Warehousing
10 (100.0%)
0 (0.0%)
Utilities
0 (0.0%)
0 (0.0%)
Information
0 (0.0%)
0 (0.0%)
Finance & Insurance
0 (0.0%)
0 (0.0%)
Real Estate, Rental & Leasing
0 (0.0%)
0 (0.0%)
Professional & Scientific
62 (65.3%)
33 (34.7%)
Enterprise Management
0 (0.0%)
0 (0.0%)
Administrative & Support
12 (100.0%)
0 (0.0%)
Educational Services
133 (41.0%)
191 (59.0%)
Health Care & Social Assistance
0 (0.0%)
0 (0.0%)
Arts, Entertainment & Recreation
12 (13.3%)
78 (86.7%)
Accommodation & Food Services
41 (27.9%)
106 (72.1%)
Public Administration
8 (17.8%)
37 (82.2%)
Total
312 (36.7%)
537 (63.2%)
Education in Zip Code 92093
School Enrollment in Zip Code 92093
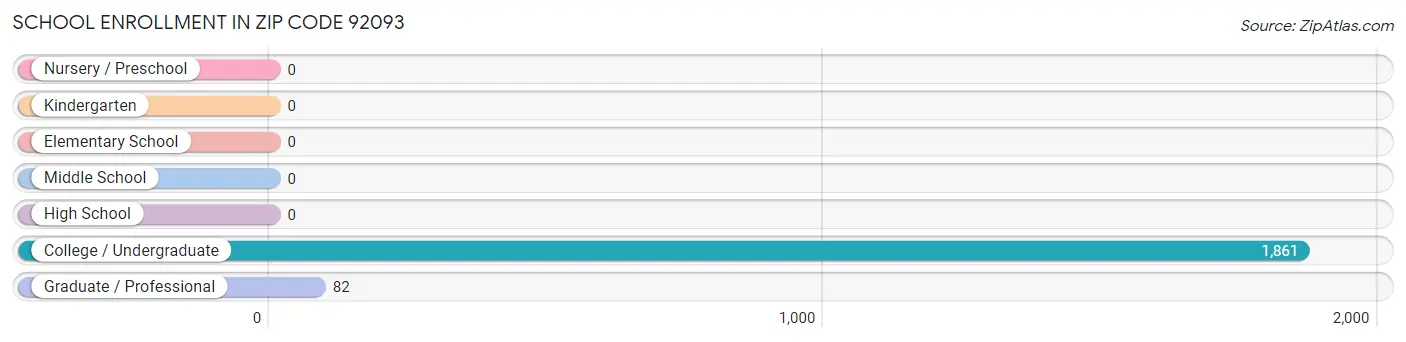
The most common levels of schooling among the 1,943 students in Zip Code 92093 are college / undergraduate (1,861 | 95.8%), and graduate / professional (82 | 4.2%).
School Level
# Students
% Students
Nursery / Preschool
0
0.0%
Kindergarten
0
0.0%
Elementary School
0
0.0%
Middle School
0
0.0%
High School
0
0.0%
College / Undergraduate
1,861
95.8%
Graduate / Professional
82
4.2%
Total
1,943
100.0%
School Enrollment by Age by Funding Source in Zip Code 92093
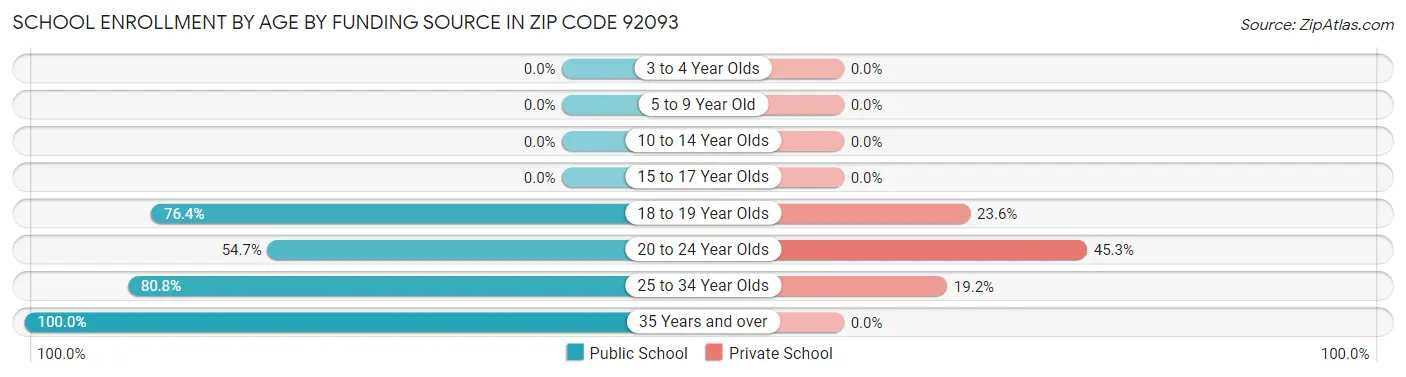
Out of a total of 1,943 students who are enrolled in schools in Zip Code 92093, 534 (27.5%) attend a private institution, while the remaining 1,409 (72.5%) are enrolled in public schools. The age group of 20 to 24 year olds has the highest likelihood of being enrolled in private schools, with 168 (45.3% in the age bracket) enrolled. Conversely, the age group of 35 years and over has the lowest likelihood of being enrolled in a private school, with 9 (100.0% in the age bracket) attending a public institution.
Age Bracket
Public School
Private School
3 to 4 Year Olds
0 (0.0%)
0 (0.0%)
5 to 9 Year Old
0 (0.0%)
0 (0.0%)
10 to 14 Year Olds
0 (0.0%)
0 (0.0%)
15 to 17 Year Olds
0 (0.0%)
0 (0.0%)
18 to 19 Year Olds
1,155 (76.4%)
356 (23.6%)
20 to 24 Year Olds
203 (54.7%)
168 (45.3%)
25 to 34 Year Olds
42 (80.8%)
10 (19.2%)
35 Years and over
9 (100.0%)
0 (0.0%)
Total
1,409 (72.5%)
534 (27.5%)
Educational Attainment by Field of Study in Zip Code 92093
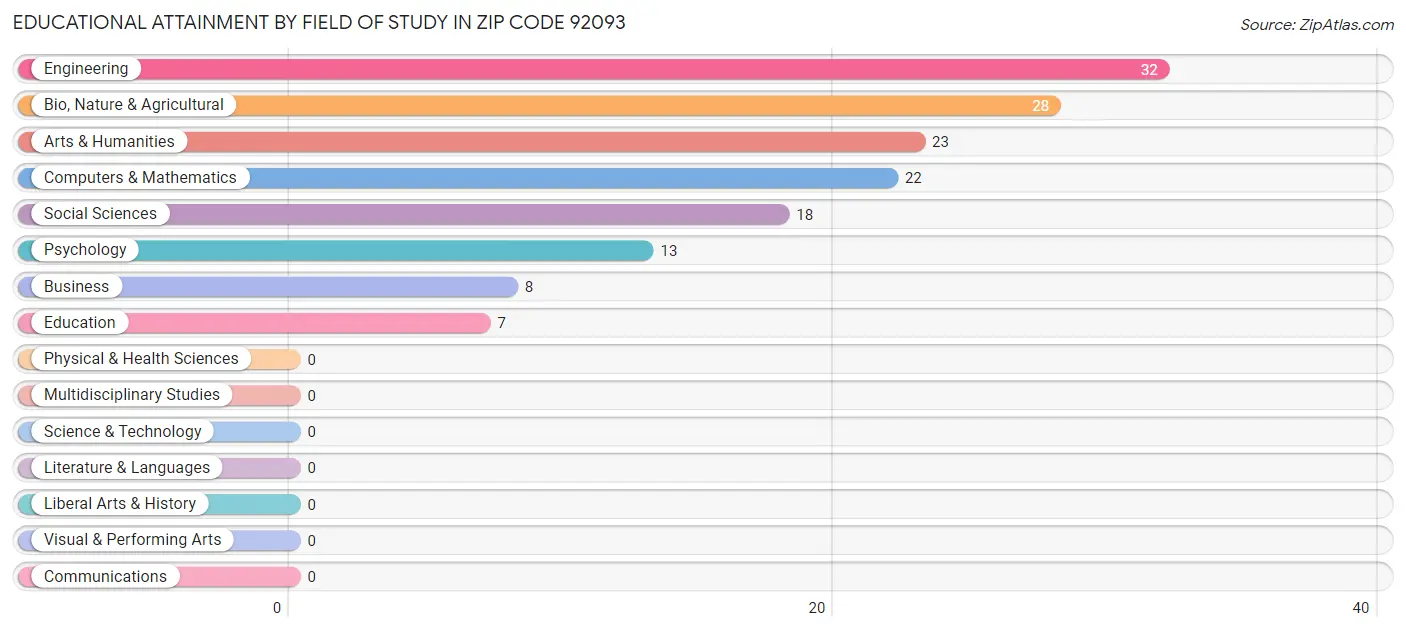
Engineering (32 | 21.2%), bio, nature & agricultural (28 | 18.5%), arts & humanities (23 | 15.2%), computers & mathematics (22 | 14.6%), and social sciences (18 | 11.9%) are the most common fields of study among 151 individuals in Zip Code 92093 who have obtained a bachelor's degree or higher.
Field of Study
# Graduates
% Graduates
Computers & Mathematics
22
14.6%
Bio, Nature & Agricultural
28
18.5%
Physical & Health Sciences
0
0.0%
Psychology
13
8.6%
Social Sciences
18
11.9%
Engineering
32
21.2%
Multidisciplinary Studies
0
0.0%
Science & Technology
0
0.0%
Business
8
5.3%
Education
7
4.6%
Literature & Languages
0
0.0%
Liberal Arts & History
0
0.0%
Visual & Performing Arts
0
0.0%
Communications
0
0.0%
Arts & Humanities
23
15.2%
Total
151
100.0%
Transportation & Commute in Zip Code 92093
Vehicle Availability by Sex in Zip Code 92093
Vehicles Available
Male
Female
No Vehicle
0 (0.0%)
0 (0.0%)
1 Vehicle
0 (0.0%)
0 (0.0%)
2 Vehicles
0 (0.0%)
0 (0.0%)
3 Vehicles
0 (0.0%)
0 (0.0%)
4 Vehicles
0 (0.0%)
0 (0.0%)
5 or more Vehicles
0 (0.0%)
0 (0.0%)
Total
0 (0.0%)
0 (0.0%)
Commute Time in Zip Code 92093
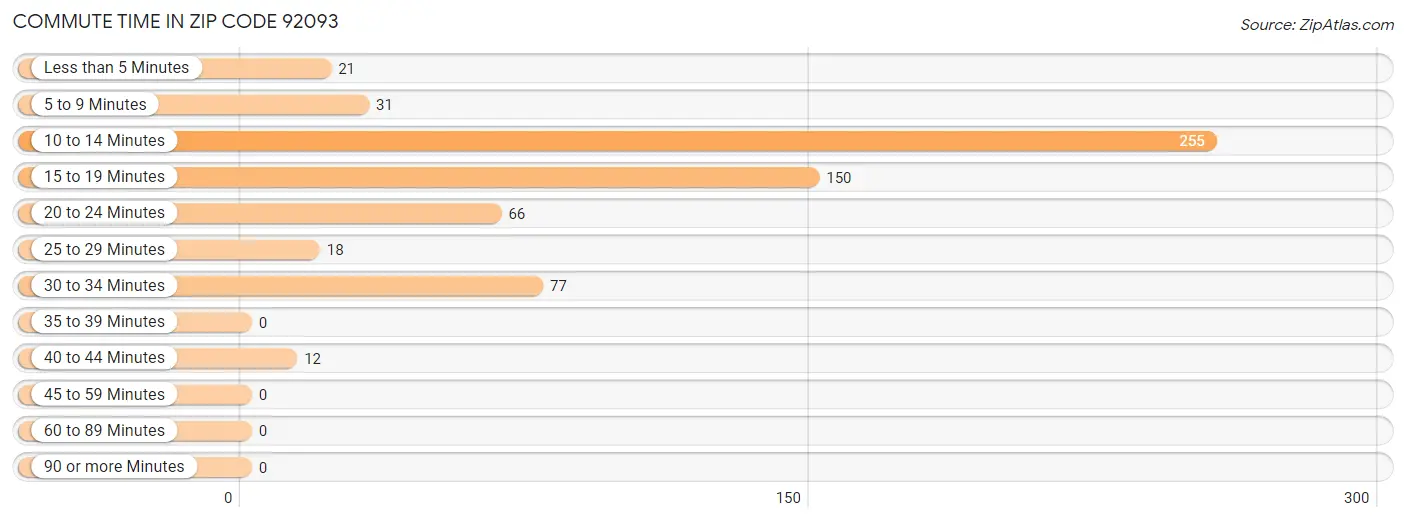
The most frequently occuring commute durations in Zip Code 92093 are 10 to 14 minutes (255 commuters, 40.5%), 15 to 19 minutes (150 commuters, 23.8%), and 30 to 34 minutes (77 commuters, 12.2%).
Commute Time
# Commuters
% Commuters
Less than 5 Minutes
21
3.3%
5 to 9 Minutes
31
4.9%
10 to 14 Minutes
255
40.5%
15 to 19 Minutes
150
23.8%
20 to 24 Minutes
66
10.5%
25 to 29 Minutes
18
2.9%
30 to 34 Minutes
77
12.2%
35 to 39 Minutes
0
0.0%
40 to 44 Minutes
12
1.9%
45 to 59 Minutes
0
0.0%
60 to 89 Minutes
0
0.0%
90 or more Minutes
0
0.0%
Commute Time by Sex in Zip Code 92093
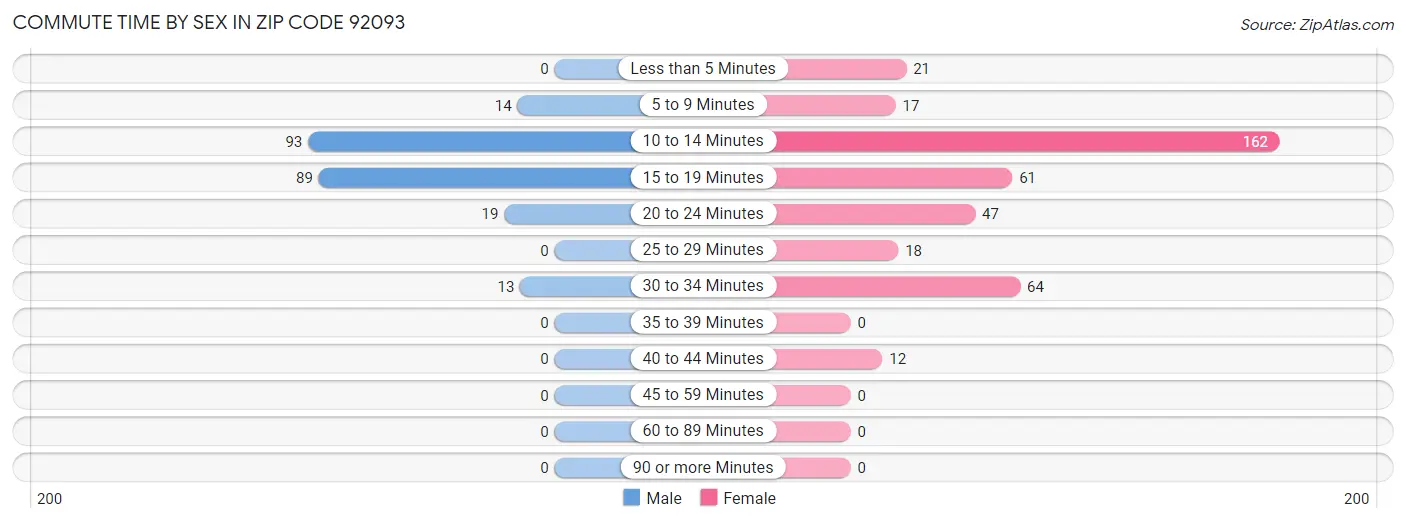
The most common commute times in Zip Code 92093 are 10 to 14 minutes (93 commuters, 40.8%) for males and 10 to 14 minutes (162 commuters, 40.3%) for females.
Commute Time
Male
Female
Less than 5 Minutes
0 (0.0%)
21 (5.2%)
5 to 9 Minutes
14 (6.1%)
17 (4.2%)
10 to 14 Minutes
93 (40.8%)
162 (40.3%)
15 to 19 Minutes
89 (39.0%)
61 (15.2%)
20 to 24 Minutes
19 (8.3%)
47 (11.7%)
25 to 29 Minutes
0 (0.0%)
18 (4.5%)
30 to 34 Minutes
13 (5.7%)
64 (15.9%)
35 to 39 Minutes
0 (0.0%)
0 (0.0%)
40 to 44 Minutes
0 (0.0%)
12 (3.0%)
45 to 59 Minutes
0 (0.0%)
0 (0.0%)
60 to 89 Minutes
0 (0.0%)
0 (0.0%)
90 or more Minutes
0 (0.0%)
0 (0.0%)
Time of Departure to Work by Sex in Zip Code 92093
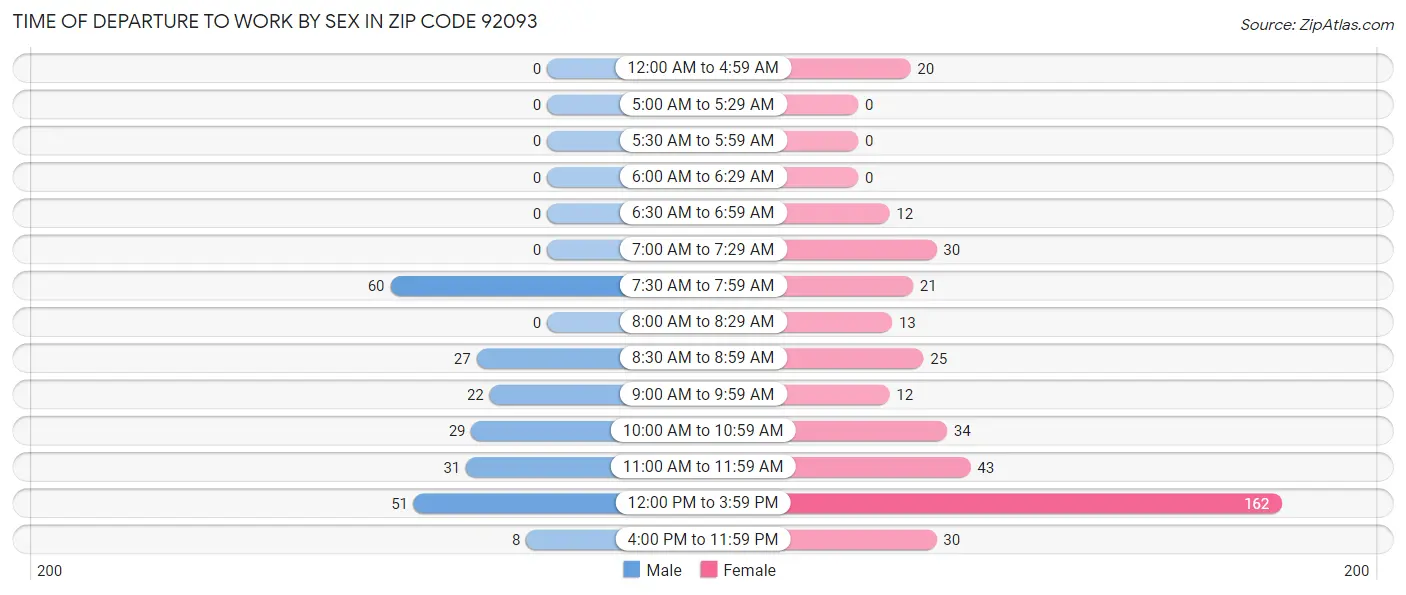
The most frequent times of departure to work in Zip Code 92093 are 7:30 AM to 7:59 AM (60, 26.3%) for males and 12:00 PM to 3:59 PM (162, 40.3%) for females.
Time of Departure
Male
Female
12:00 AM to 4:59 AM
0 (0.0%)
20 (5.0%)
5:00 AM to 5:29 AM
0 (0.0%)
0 (0.0%)
5:30 AM to 5:59 AM
0 (0.0%)
0 (0.0%)
6:00 AM to 6:29 AM
0 (0.0%)
0 (0.0%)
6:30 AM to 6:59 AM
0 (0.0%)
12 (3.0%)
7:00 AM to 7:29 AM
0 (0.0%)
30 (7.5%)
7:30 AM to 7:59 AM
60 (26.3%)
21 (5.2%)
8:00 AM to 8:29 AM
0 (0.0%)
13 (3.2%)
8:30 AM to 8:59 AM
27 (11.8%)
25 (6.2%)
9:00 AM to 9:59 AM
22 (9.7%)
12 (3.0%)
10:00 AM to 10:59 AM
29 (12.7%)
34 (8.5%)
11:00 AM to 11:59 AM
31 (13.6%)
43 (10.7%)
12:00 PM to 3:59 PM
51 (22.4%)
162 (40.3%)
4:00 PM to 11:59 PM
8 (3.5%)
30 (7.5%)
Total
228 (100.0%)
402 (100.0%)
Housing Occupancy in Zip Code 92093
Occupancy by Ownership in Zip Code 92093
Occupancy
# Housing Units
% Housing Units
Owner Occupied Housing Units
0
0.0%
Renter-Occupied Housing Units
0
0.0%
Total Occupied Housing Units
0
0.0%
Occupancy by Household Size in Zip Code 92093
Household Size
# Housing Units
% Housing Units
1-Person Household
0
0.0%
2-Person Household
0
0.0%
3-Person Household
0
0.0%
4+ Person Household
0
0.0%
Total Housing Units
0
0.0%
Occupancy by Ownership by Household Size in Zip Code 92093
Household Size
Owner-occupied
Renter-occupied
1-Person Household
0 (0.0%)
0 (0.0%)
2-Person Household
0 (0.0%)
0 (0.0%)
3-Person Household
0 (0.0%)
0 (0.0%)
4+ Person Household
0 (0.0%)
0 (0.0%)
Total Housing Units
0 (0.0%)
0 (0.0%)
Occupancy by Educational Attainment in Zip Code 92093
Household Size
Owner-occupied
Renter-occupied
Less than High School
0 (0.0%)
0 (0.0%)
High School Diploma
0 (0.0%)
0 (0.0%)
College/Associate Degree
0 (0.0%)
0 (0.0%)
Bachelor's Degree or higher
0 (0.0%)
0 (0.0%)
Occupancy by Age of Householder in Zip Code 92093
Age Bracket
# Households
% Households
Under 35 Years
0
0.0%
35 to 44 Years
0
0.0%
45 to 54 Years
0
0.0%
55 to 64 Years
0
0.0%
65 to 74 Years
0
0.0%
75 to 84 Years
0
0.0%
85 Years and Over
0
0.0%
Total
0
0.0%
Housing Finances in Zip Code 92093
Median Income by Occupancy in Zip Code 92093
Occupancy Type
# Households
Median Income
Owner-Occupied
0 (0.0%)
$0
Renter-Occupied
0 (0.0%)
$0
Average
0 (0.0%)
$0
Occupancy by Householder Income Bracket in Zip Code 92093
Income Bracket
Owner-occupied
Renter-occupied
Less than $5,000
0 (0.0%)
0 (0.0%)
$5,000 to $9,999
0 (0.0%)
0 (0.0%)
$10,000 to $14,999
0 (0.0%)
0 (0.0%)
$15,000 to $19,999
0 (0.0%)
0 (0.0%)
$20,000 to $24,999
0 (0.0%)
0 (0.0%)
$25,000 to $34,999
0 (0.0%)
0 (0.0%)
$35,000 to $49,999
0 (0.0%)
0 (0.0%)
$50,000 to $74,999
0 (0.0%)
0 (0.0%)
$75,000 to $99,999
0 (0.0%)
0 (0.0%)
$100,000 to $149,999
0 (0.0%)
0 (0.0%)
$150,000 or more
0 (0.0%)
0 (0.0%)
Total
0 (0.0%)
0 (0.0%)
Monthly Housing Cost Tiers in Zip Code 92093
Monthly Cost
Owner-occupied
Renter-occupied
Less than $300
0 (0.0%)
0 (0.0%)
$300 to $499
0 (0.0%)
0 (0.0%)
$500 to $799
0 (0.0%)
0 (0.0%)
$800 to $999
0 (0.0%)
0 (0.0%)
$1,000 to $1,499
0 (0.0%)
0 (0.0%)
$1,500 to $1,999
0 (0.0%)
0 (0.0%)
$2,000 to $2,499
0 (0.0%)
0 (0.0%)
$2,500 to $2,999
0 (0.0%)
0 (0.0%)
$3,000 or more
0 (0.0%)
0 (0.0%)
Total
0 (0.0%)
0 (0.0%)
Physical Housing Characteristics in Zip Code 92093
Housing Structures in Zip Code 92093
Structure Type
# Housing Units
% Housing Units
Single Unit, Detached
0
0.0%
Single Unit, Attached
0
0.0%
2 Unit Apartments
0
0.0%
3 or 4 Unit Apartments
0
0.0%
5 to 9 Unit Apartments
0
0.0%
10 or more Apartments
0
0.0%
Mobile Home / Other
0
0.0%
Total
0
0.0%
Housing Structures by Occupancy in Zip Code 92093
Structure Type
Owner-occupied
Renter-occupied
Single Unit, Detached
0 (0.0%)
0 (0.0%)
Single Unit, Attached
0 (0.0%)
0 (0.0%)
2 Unit Apartments
0 (0.0%)
0 (0.0%)
3 or 4 Unit Apartments
0 (0.0%)
0 (0.0%)
5 to 9 Unit Apartments
0 (0.0%)
0 (0.0%)
10 or more Apartments
0 (0.0%)
0 (0.0%)
Mobile Home / Other
0 (0.0%)
0 (0.0%)
Total
0 (0.0%)
0 (0.0%)
Housing Structures by Number of Rooms in Zip Code 92093
Number of Rooms
Owner-occupied
Renter-occupied
1 Room
0 (0.0%)
0 (0.0%)
2 or 3 Rooms
0 (0.0%)
0 (0.0%)
4 or 5 Rooms
0 (0.0%)
0 (0.0%)
6 or 7 Rooms
0 (0.0%)
0 (0.0%)
8 or more Rooms
0 (0.0%)
0 (0.0%)
Total
0 (0.0%)
0 (0.0%)
Housing Structure by Heating Type in Zip Code 92093
Heating Type
Owner-occupied
Renter-occupied
Utility Gas
0 (0.0%)
0 (0.0%)
Bottled, Tank, or LP Gas
0 (0.0%)
0 (0.0%)
Electricity
0 (0.0%)
0 (0.0%)
Fuel Oil or Kerosene
0 (0.0%)
0 (0.0%)
Coal or Coke
0 (0.0%)
0 (0.0%)
All other Fuels
0 (0.0%)
0 (0.0%)
No Fuel Used
0 (0.0%)
0 (0.0%)
Total
0 (0.0%)
0 (0.0%)
Household Vehicle Usage in Zip Code 92093
Vehicles per Household
Owner-occupied
Renter-occupied
No Vehicle
0 (0.0%)
0 (0.0%)
1 Vehicle
0 (0.0%)
0 (0.0%)
2 Vehicles
0 (0.0%)
0 (0.0%)
3 or more Vehicles
0 (0.0%)
0 (0.0%)
Total
0 (0.0%)
0 (0.0%)
Real Estate & Mortgages in Zip Code 92093
Real Estate and Mortgage Overview in Zip Code 92093
Characteristic
Without Mortgage
With Mortgage
Housing Units
0
0
Median Property Value
-
-
Median Household Income
-
-
Monthly Housing Costs
-
-
Real Estate Taxes
-
-
Property Value by Mortgage Status in Zip Code 92093
Property Value
Without Mortgage
With Mortgage
Less than $50,000
0 (0.0%)
0 (0.0%)
$50,000 to $99,999
0 (0.0%)
0 (0.0%)
$100,000 to $299,999
0 (0.0%)
0 (0.0%)
$300,000 to $499,999
0 (0.0%)
0 (0.0%)
$500,000 to $749,999
0 (0.0%)
0 (0.0%)
$750,000 to $999,999
0 (0.0%)
0 (0.0%)
$1,000,000 or more
0 (0.0%)
0 (0.0%)
Total
0 (0.0%)
0 (0.0%)
Household Income by Mortgage Status in Zip Code 92093
Household Income
Without Mortgage
With Mortgage
Less than $10,000
0 (0.0%)
0 (0.0%)
$10,000 to $24,999
0 (0.0%)
0 (0.0%)
$25,000 to $34,999
0 (0.0%)
0 (0.0%)
$35,000 to $49,999
0 (0.0%)
0 (0.0%)
$50,000 to $74,999
0 (0.0%)
0 (0.0%)
$75,000 to $99,999
0 (0.0%)
0 (0.0%)
$100,000 to $149,999
0 (0.0%)
0 (0.0%)
$150,000 or more
0 (0.0%)
0 (0.0%)
Total
0 (0.0%)
0 (0.0%)
Property Value to Household Income Ratio in Zip Code 92093
Value-to-Income Ratio
Without Mortgage
With Mortgage
Less than 2.0x
0 (0.0%)
0 (0.0%)
2.0x to 2.9x
0 (0.0%)
0 (0.0%)
3.0x to 3.9x
0 (0.0%)
0 (0.0%)
4.0x or more
0 (0.0%)
0 (0.0%)
Total
0 (0.0%)
0 (0.0%)
Real Estate Taxes by Mortgage Status in Zip Code 92093
Property Taxes
Without Mortgage
With Mortgage
Less than $800
0 (0.0%)
0 (0.0%)
$800 to $1,499
0 (0.0%)
0 (0.0%)
$800 to $1,499
0 (0.0%)
0 (0.0%)
Total
0 (0.0%)
0 (0.0%)
Health & Disability in Zip Code 92093
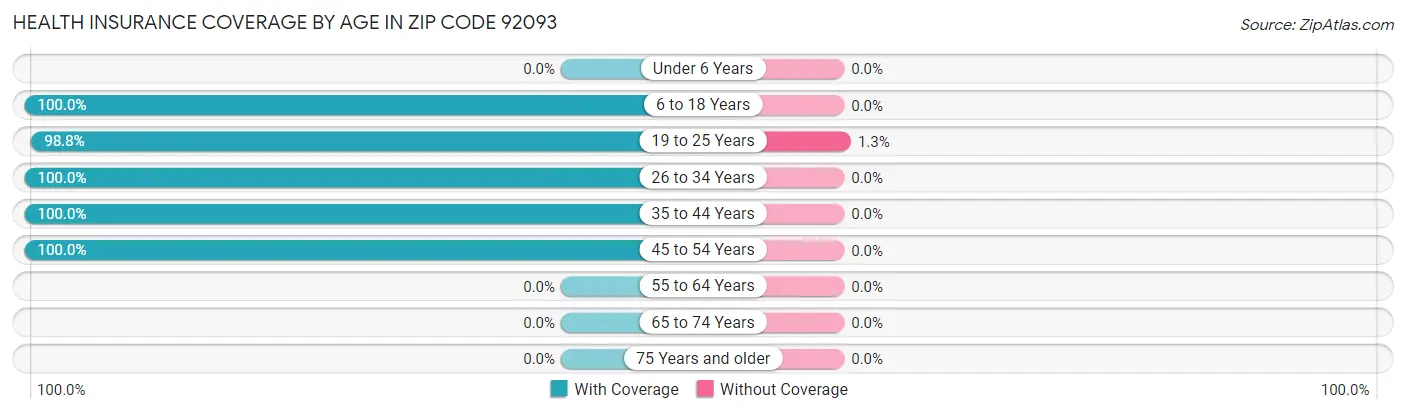
Health Insurance Coverage by Age in Zip Code 92093
Age Bracket
With Coverage
Without Coverage
Under 6 Years
0 (0.0%)
0 (0.0%)
6 to 18 Years
845 (100.0%)
0 (0.0%)
19 to 25 Years
1,025 (98.8%)
13 (1.3%)
26 to 34 Years
94 (100.0%)
0 (0.0%)
35 to 44 Years
54 (100.0%)
0 (0.0%)
45 to 54 Years
13 (100.0%)
0 (0.0%)
55 to 64 Years
0 (0.0%)
0 (0.0%)
65 to 74 Years
0 (0.0%)
0 (0.0%)
75 Years and older
0 (0.0%)
0 (0.0%)
Total
2,031 (99.4%)
13 (0.6%)
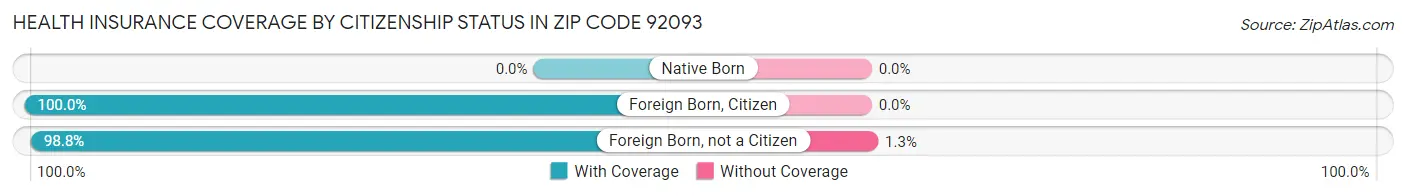
Health Insurance Coverage by Citizenship Status in Zip Code 92093
Citizenship Status
With Coverage
Without Coverage
Native Born
0 (0.0%)
0 (0.0%)
Foreign Born, Citizen
845 (100.0%)
0 (0.0%)
Foreign Born, not a Citizen
1,025 (98.8%)
13 (1.3%)
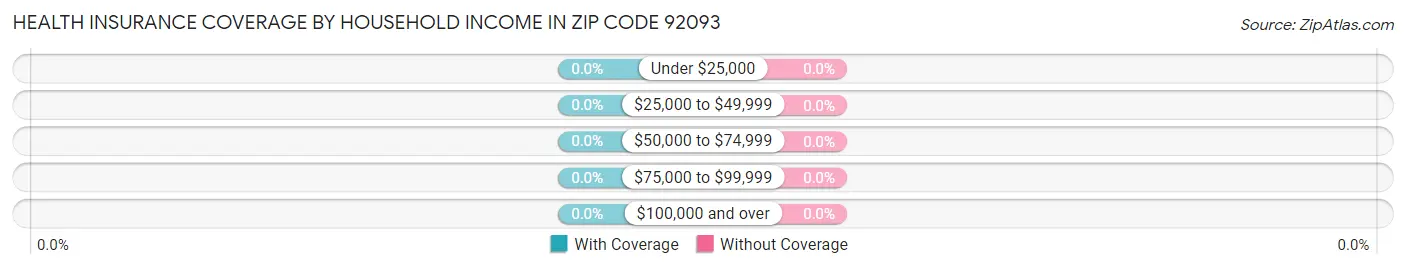
Health Insurance Coverage by Household Income in Zip Code 92093
Household Income
With Coverage
Without Coverage
Under $25,000
0 (0.0%)
0 (0.0%)
$25,000 to $49,999
0 (0.0%)
0 (0.0%)
$50,000 to $74,999
0 (0.0%)
0 (0.0%)
$75,000 to $99,999
0 (0.0%)
0 (0.0%)
$100,000 and over
0 (0.0%)
0 (0.0%)
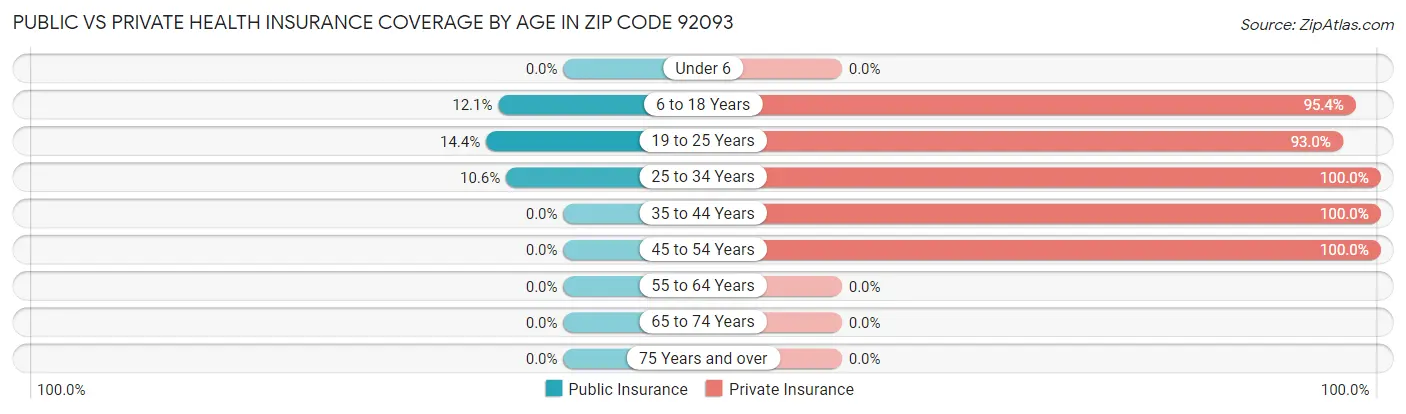
Public vs Private Health Insurance Coverage by Age in Zip Code 92093
Age Bracket
Public Insurance
Private Insurance
Under 6
0 (0.0%)
0 (0.0%)
6 to 18 Years
102 (12.1%)
806 (95.4%)
19 to 25 Years
149 (14.3%)
965 (93.0%)
25 to 34 Years
10 (10.6%)
94 (100.0%)
35 to 44 Years
0 (0.0%)
54 (100.0%)
45 to 54 Years
0 (0.0%)
13 (100.0%)
55 to 64 Years
0 (0.0%)
0 (0.0%)
65 to 74 Years
0 (0.0%)
0 (0.0%)
75 Years and over
0 (0.0%)
0 (0.0%)
Total
261 (12.8%)
1,932 (94.5%)
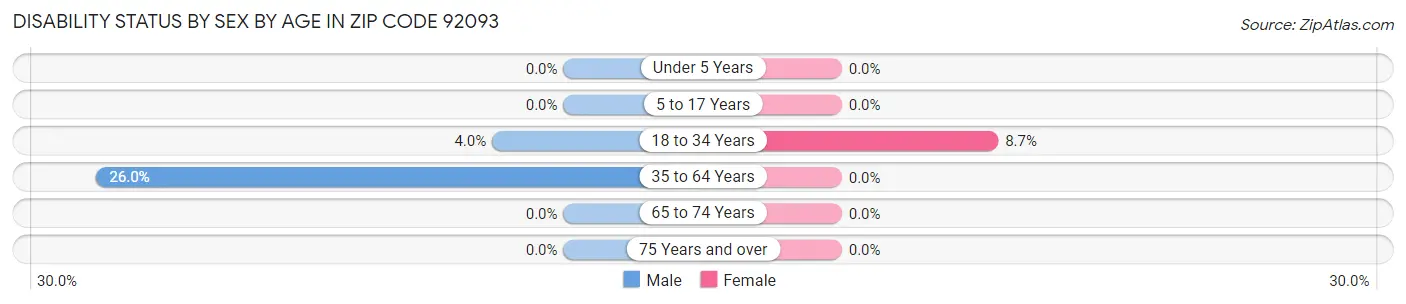
Disability Status by Sex by Age in Zip Code 92093
Age Bracket
Male
Female
Under 5 Years
0 (0.0%)
0 (0.0%)
5 to 17 Years
0 (0.0%)
0 (0.0%)
18 to 34 Years
32 (4.0%)
102 (8.7%)
35 to 64 Years
13 (26.0%)
0 (0.0%)
65 to 74 Years
0 (0.0%)
0 (0.0%)
75 Years and over
0 (0.0%)
0 (0.0%)
Disability Class by Sex by Age in Zip Code 92093
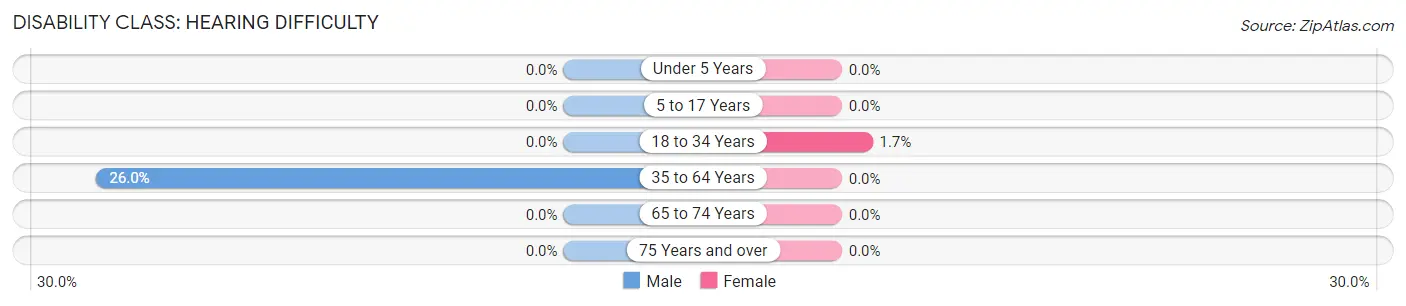
Disability Class: Hearing Difficulty
Age Bracket
Male
Female
Under 5 Years
0 (0.0%)
0 (0.0%)
5 to 17 Years
0 (0.0%)
0 (0.0%)
18 to 34 Years
0 (0.0%)
20 (1.7%)
35 to 64 Years
13 (26.0%)
0 (0.0%)
65 to 74 Years
0 (0.0%)
0 (0.0%)
75 Years and over
0 (0.0%)
0 (0.0%)
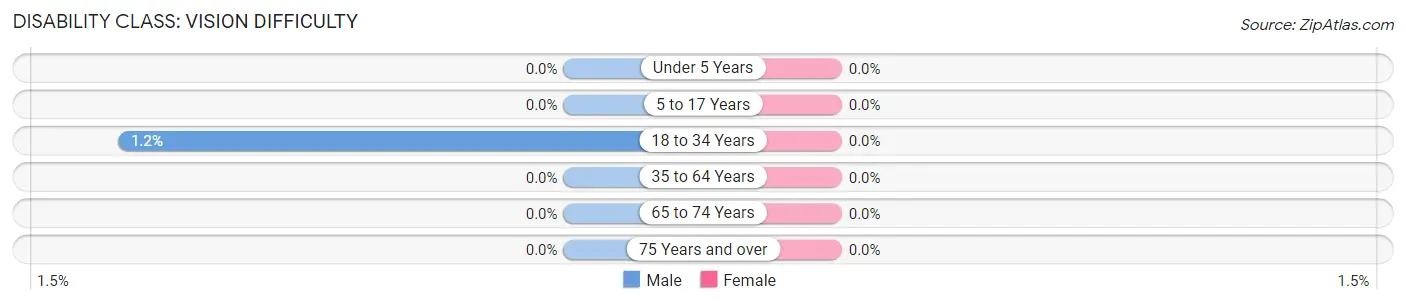
Disability Class: Vision Difficulty
Age Bracket
Male
Female
Under 5 Years
0 (0.0%)
0 (0.0%)
5 to 17 Years
0 (0.0%)
0 (0.0%)
18 to 34 Years
10 (1.2%)
0 (0.0%)
35 to 64 Years
0 (0.0%)
0 (0.0%)
65 to 74 Years
0 (0.0%)
0 (0.0%)
75 Years and over
0 (0.0%)
0 (0.0%)
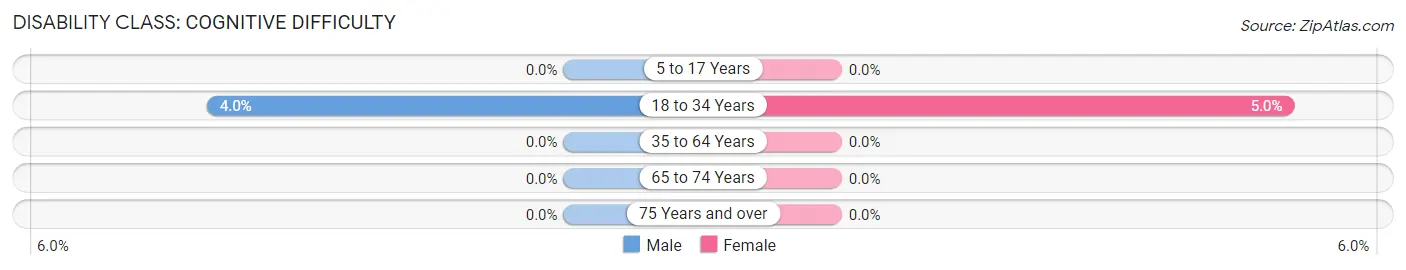
Disability Class: Cognitive Difficulty
Age Bracket
Male
Female
5 to 17 Years
0 (0.0%)
0 (0.0%)
18 to 34 Years
32 (4.0%)
59 (5.0%)
35 to 64 Years
0 (0.0%)
0 (0.0%)
65 to 74 Years
0 (0.0%)
0 (0.0%)
75 Years and over
0 (0.0%)
0 (0.0%)
Disability Class: Ambulatory Difficulty
Age Bracket
Male
Female
5 to 17 Years
0 (0.0%)
0 (0.0%)
18 to 34 Years
0 (0.0%)
0 (0.0%)
35 to 64 Years
0 (0.0%)
0 (0.0%)
65 to 74 Years
0 (0.0%)
0 (0.0%)
75 Years and over
0 (0.0%)
0 (0.0%)
Disability Class: Self-Care Difficulty
Age Bracket
Male
Female
5 to 17 Years
0 (0.0%)
0 (0.0%)
18 to 34 Years
0 (0.0%)
0 (0.0%)
35 to 64 Years
0 (0.0%)
0 (0.0%)
65 to 74 Years
0 (0.0%)
0 (0.0%)
75 Years and over
0 (0.0%)
0 (0.0%)
Technology Access in Zip Code 92093
Computing Device Access in Zip Code 92093
Device Type
# Households
% Households
Desktop or Laptop
0
0.0%
Smartphone
0
0.0%
Tablet
0
0.0%
No Computing Device
0
0.0%
Total
0
0.0%
Internet Access in Zip Code 92093
Internet Type
# Households
% Households
Dial-Up Internet
0
0.0%
Broadband Home
0
0.0%
Cellular Data Only
0
0.0%
Satellite Internet
0
0.0%
No Internet
0
0.0%
Total
0
0.0%
Common Questions
What is Per Capita Income in Zip Code 92093?
Per Capita income in Zip Code 92093 is $9,398.
What is Income or Wage Gap in Zip Code 92093?
Income or Wage Gap in Zip Code 92093 is 18.9%.
Women in Zip Code 92093 earn 81.1 cents for every dollar earned by a man.
What is the Total Population of Zip Code 92093?
Total Population of Zip Code 92093 is 2,044.
What is the Total Male Population of Zip Code 92093?
Total Male Population of Zip Code 92093 is 856.
What is the Total Female Population of Zip Code 92093?
Total Female Population of Zip Code 92093 is 1,188.
What is the Ratio of Males per 100 Females in Zip Code 92093?
There are 72.05 Males per 100 Females in Zip Code 92093.
What is the Ratio of Females per 100 Males in Zip Code 92093?
There are 138.79 Females per 100 Males in Zip Code 92093.
What is the Median Population Age in Zip Code 92093?
Median Population Age in Zip Code 92093 is 19.3 Years.
How Large is the Labor Force in Zip Code 92093?
There are 997 People in the Labor Forcein in Zip Code 92093.
What is the Percentage of People in the Labor Force in Zip Code 92093?
48.8% of People are in the Labor Force in Zip Code 92093.
What is the Unemployment Rate in Zip Code 92093?
Unemployment Rate in Zip Code 92093 is 14.9%.
Report Title
Report Link
HTML Copy & Paste Link
Social Media
Copy and paste the folowing code into any webpage where you would like this interactive chart to display