Zip Codes with the Highest Percentage of Households with Income Below $10,000 in Trabuco Canyon, CA
RELATED REPORTS & OPTIONS
Household Income | $0-10k
Trabuco Canyon
Compare Zip Codes
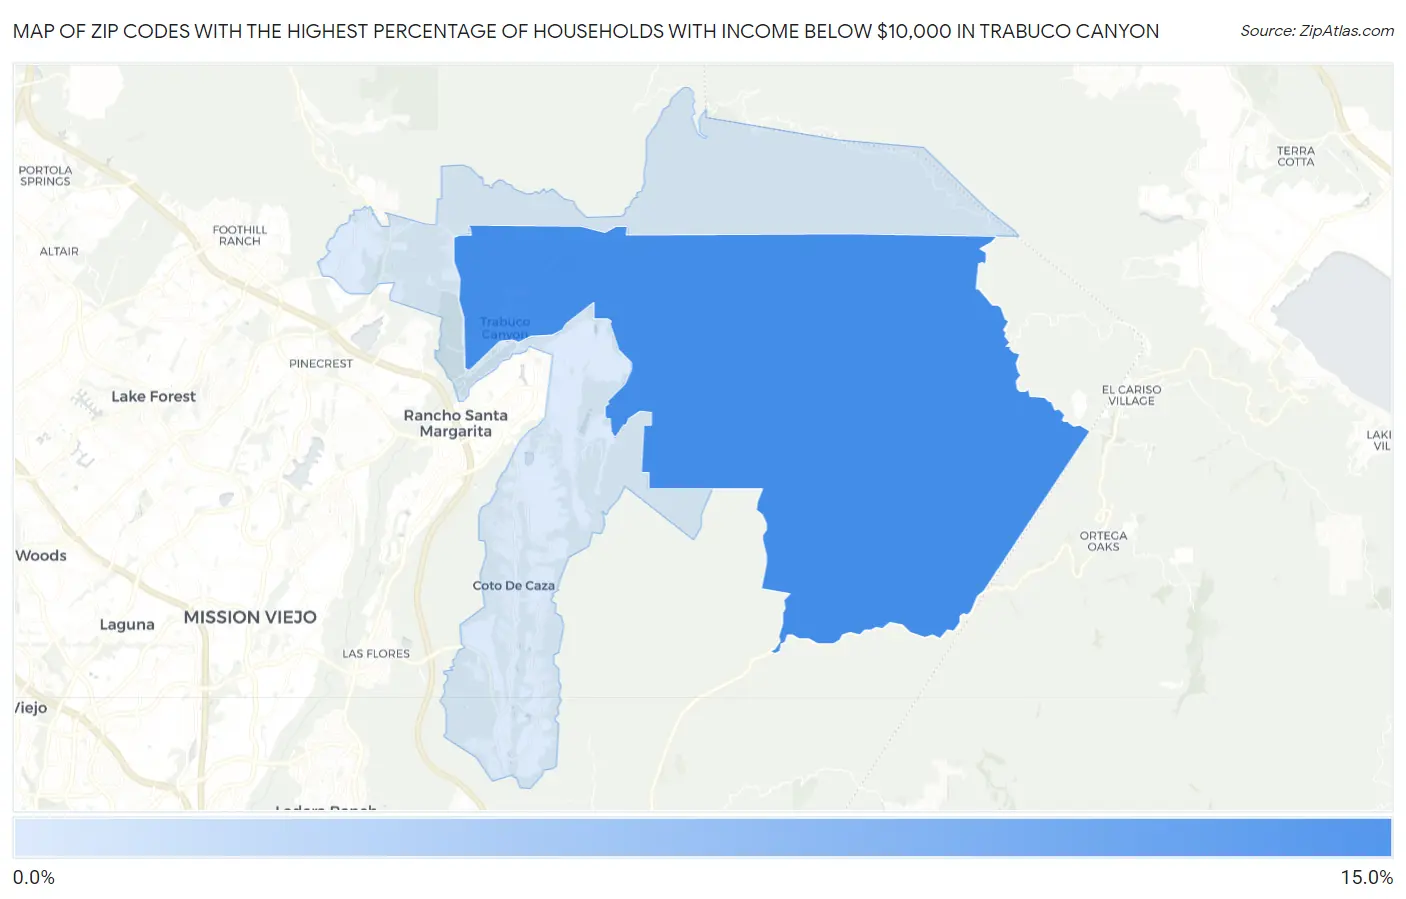
Map of Zip Codes with the Highest Percentage of Households with Income Below $10,000 in Trabuco Canyon
2.4%
10.5%
Zip Codes with the Highest Percentage of Households with Income Below $10,000 in Trabuco Canyon, CA
| Zip Code | Households with Income < $10k | vs State | vs National | |
| 1. | 92678 | 10.5% | 4.4%(+6.10)#132 | 4.9%(+5.60)#3,274 |
| 2. | 92679 | 2.4% | 4.4%(-2.00)#1,287 | 4.9%(-2.50)#22,025 |
1
Common Questions
What are the Top Zip Codes with the Highest Percentage of Households with Income Below $10,000 in Trabuco Canyon, CA?
Top Zip Codes with the Highest Percentage of Households with Income Below $10,000 in Trabuco Canyon, CA are:
What zip code has the Highest Percentage of Households with Income Below $10,000 in Trabuco Canyon, CA?
92678 has the Highest Percentage of Households with Income Below $10,000 in Trabuco Canyon, CA with 10.5%.
What is the Percentage of Households with Income Below $10,000 in Trabuco Canyon, CA?
Percentage of Households with Income Below $10,000 in Trabuco Canyon is 5.9%.
What is the Percentage of Households with Income Below $10,000 in California?
Percentage of Households with Income Below $10,000 in California is 4.4%.
What is the Percentage of Households with Income Below $10,000 in the United States?
Percentage of Households with Income Below $10,000 in the United States is 4.9%.