Zip Codes with the Highest Percentage of Households with Income Below $10,000 in Porterville, CA
RELATED REPORTS & OPTIONS
Household Income | $0-10k
Porterville
Compare Zip Codes
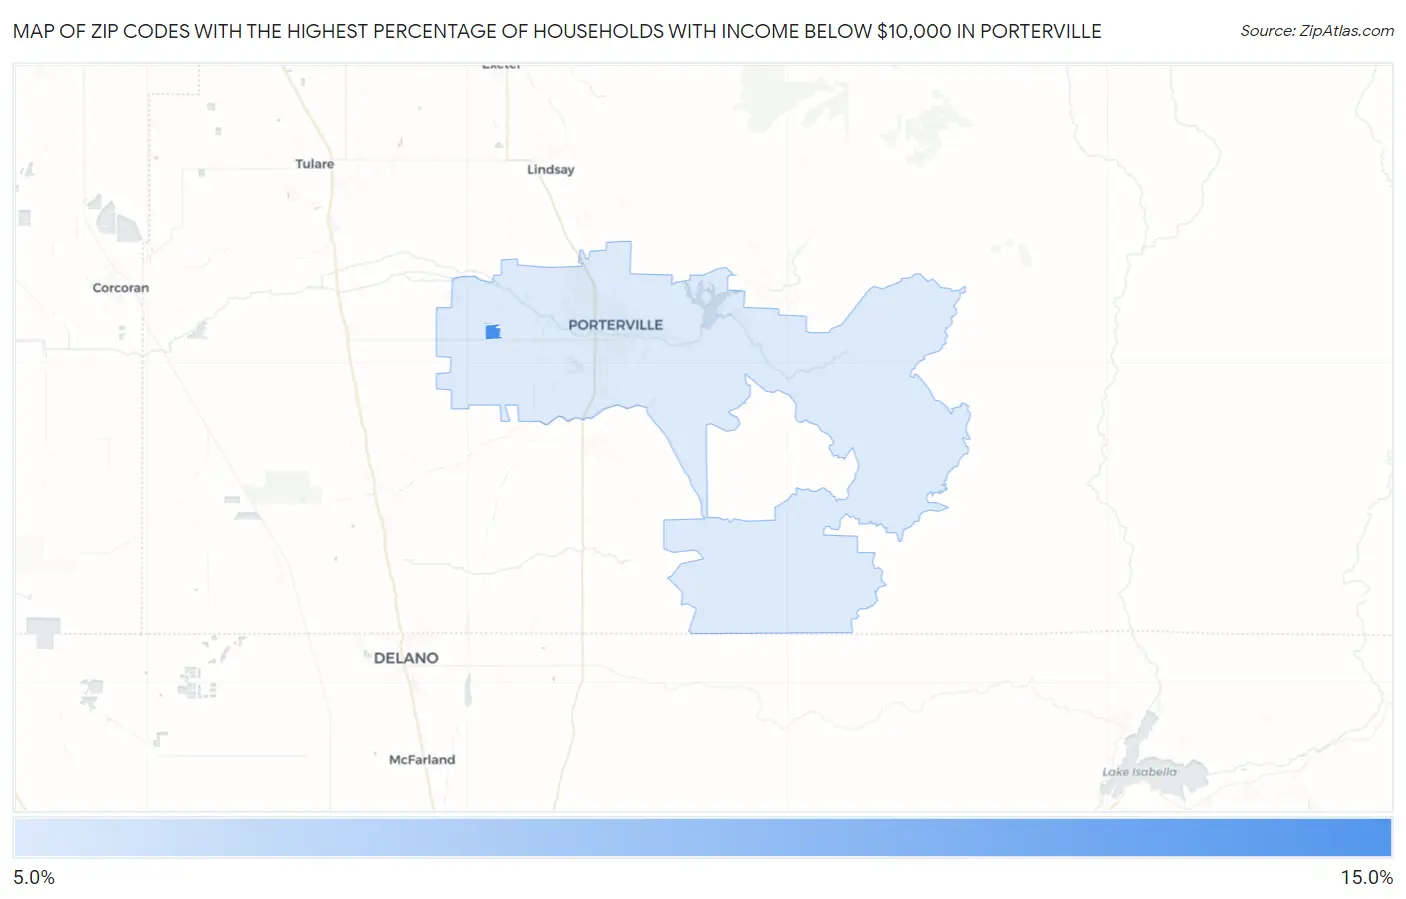
Map of Zip Codes with the Highest Percentage of Households with Income Below $10,000 in Porterville
6.1%
11.5%
Zip Codes with the Highest Percentage of Households with Income Below $10,000 in Porterville, CA
| Zip Code | Households with Income < $10k | vs State | vs National | |
| 1. | 93258 | 11.5% | 4.4%(+7.10)#107 | 4.9%(+6.60)#2,702 |
| 2. | 93257 | 6.1% | 4.4%(+1.70)#421 | 4.9%(+1.20)#8,711 |
1
Common Questions
What are the Top Zip Codes with the Highest Percentage of Households with Income Below $10,000 in Porterville, CA?
Top Zip Codes with the Highest Percentage of Households with Income Below $10,000 in Porterville, CA are:
What zip code has the Highest Percentage of Households with Income Below $10,000 in Porterville, CA?
93258 has the Highest Percentage of Households with Income Below $10,000 in Porterville, CA with 11.5%.
What is the Percentage of Households with Income Below $10,000 in Porterville, CA?
Percentage of Households with Income Below $10,000 in Porterville is 5.8%.
What is the Percentage of Households with Income Below $10,000 in California?
Percentage of Households with Income Below $10,000 in California is 4.4%.
What is the Percentage of Households with Income Below $10,000 in the United States?
Percentage of Households with Income Below $10,000 in the United States is 4.9%.