Foreman, AR Map & Demographics
Foreman Map
Foreman Overview
$20,837
PER CAPITA INCOME
$39,850
AVG FAMILY INCOME
$38,266
AVG HOUSEHOLD INCOME
50.2%
WAGE / INCOME GAP [ % ]
49.8¢/ $1
WAGE / INCOME GAP [ $ ]
$9,136
FAMILY INCOME DEFICIT
0.44
INEQUALITY / GINI INDEX
1,214
TOTAL POPULATION
553
MALE POPULATION
661
FEMALE POPULATION
83.66
MALES / 100 FEMALES
119.53
FEMALES / 100 MALES
39.1
MEDIAN AGE
3.1
AVG FAMILY SIZE
2.7
AVG HOUSEHOLD SIZE
398
LABOR FORCE [ PEOPLE ]
43.2%
PERCENT IN LABOR FORCE
10.8%
UNEMPLOYMENT RATE
Foreman Zip Codes
Foreman Area Codes
Income in Foreman
Income Overview in Foreman
Per Capita Income in Foreman is $20,837, while median incomes of families and households are $39,850 and $38,266 respectively.
| Characteristic | Number | Measure |
| Per Capita Income | 1,214 | $20,837 |
| Median Family Income | 303 | $39,850 |
| Mean Family Income | 303 | $56,584 |
| Median Household Income | 447 | $38,266 |
| Mean Household Income | 447 | $50,160 |
| Income Deficit | 303 | $9,136 |
| Wage / Income Gap (%) | 1,214 | 50.18% |
| Wage / Income Gap ($) | 1,214 | 49.82¢ per $1 |
| Gini / Inequality Index | 1,214 | 0.44 |
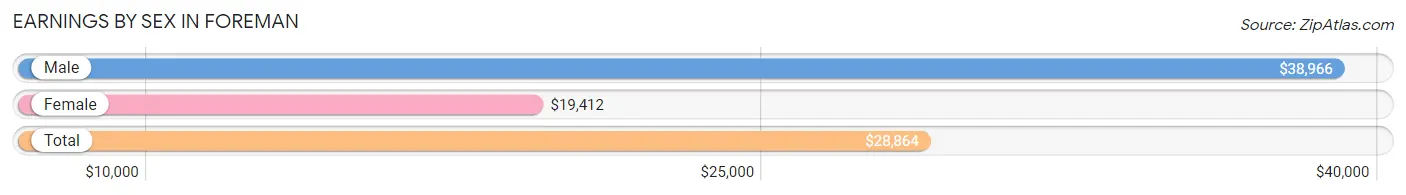
Earnings by Sex in Foreman
Average Earnings in Foreman are $28,864, $38,966 for men and $19,412 for women, a difference of 50.2%.
| Sex | Number | Average Earnings |
| Male | 248 (54.6%) | $38,966 |
| Female | 206 (45.4%) | $19,412 |
| Total | 454 (100.0%) | $28,864 |
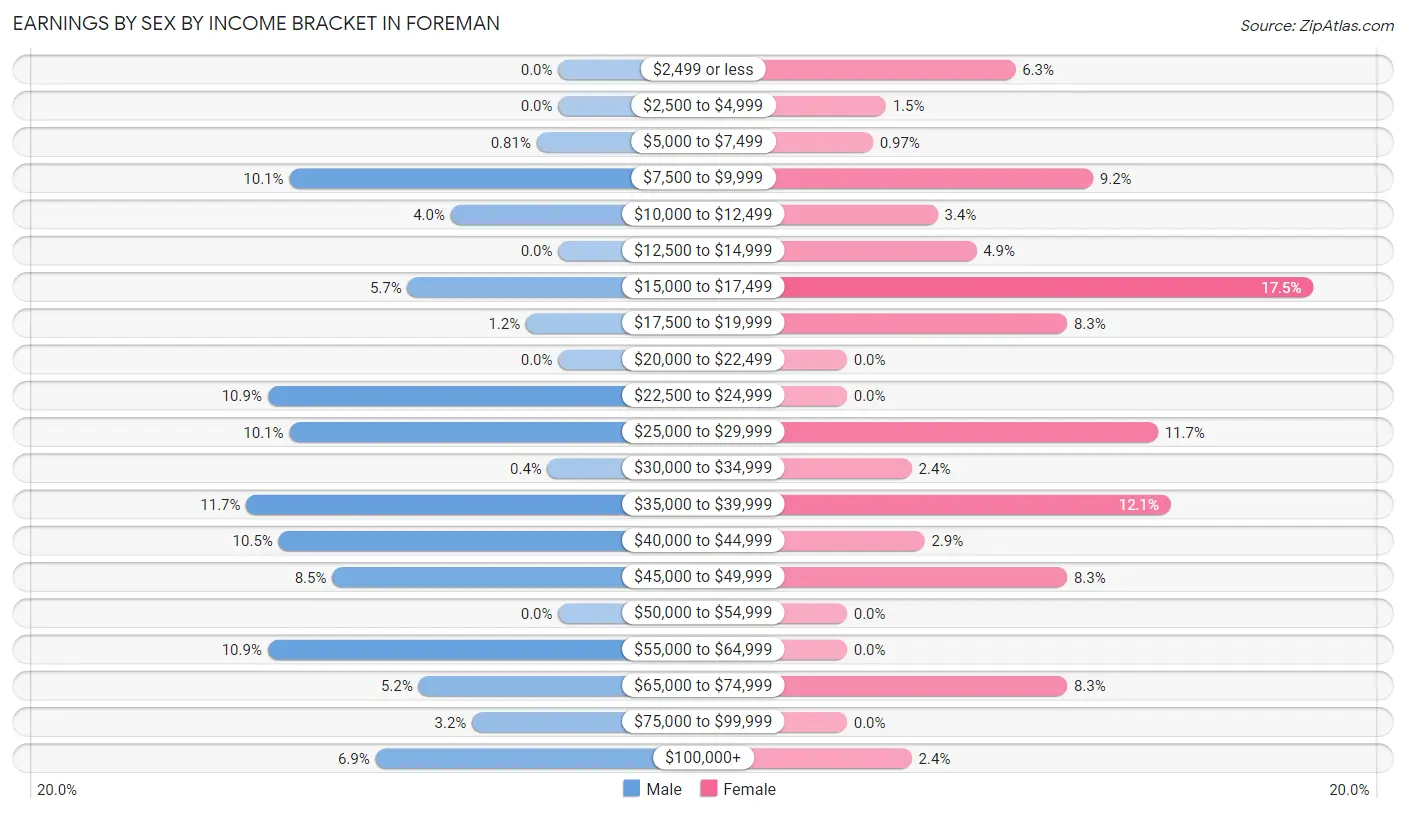
Earnings by Sex by Income Bracket in Foreman
The most common earnings brackets in Foreman are $35,000 to $39,999 for men (29 | 11.7%) and $15,000 to $17,499 for women (36 | 17.5%).
| Income | Male | Female |
| $2,499 or less | 0 (0.0%) | 13 (6.3%) |
| $2,500 to $4,999 | 0 (0.0%) | 3 (1.5%) |
| $5,000 to $7,499 | 2 (0.8%) | 2 (1.0%) |
| $7,500 to $9,999 | 25 (10.1%) | 19 (9.2%) |
| $10,000 to $12,499 | 10 (4.0%) | 7 (3.4%) |
| $12,500 to $14,999 | 0 (0.0%) | 10 (4.9%) |
| $15,000 to $17,499 | 14 (5.7%) | 36 (17.5%) |
| $17,500 to $19,999 | 3 (1.2%) | 17 (8.3%) |
| $20,000 to $22,499 | 0 (0.0%) | 0 (0.0%) |
| $22,500 to $24,999 | 27 (10.9%) | 0 (0.0%) |
| $25,000 to $29,999 | 25 (10.1%) | 24 (11.7%) |
| $30,000 to $34,999 | 1 (0.4%) | 5 (2.4%) |
| $35,000 to $39,999 | 29 (11.7%) | 25 (12.1%) |
| $40,000 to $44,999 | 26 (10.5%) | 6 (2.9%) |
| $45,000 to $49,999 | 21 (8.5%) | 17 (8.3%) |
| $50,000 to $54,999 | 0 (0.0%) | 0 (0.0%) |
| $55,000 to $64,999 | 27 (10.9%) | 0 (0.0%) |
| $65,000 to $74,999 | 13 (5.2%) | 17 (8.3%) |
| $75,000 to $99,999 | 8 (3.2%) | 0 (0.0%) |
| $100,000+ | 17 (6.9%) | 5 (2.4%) |
| Total | 248 (100.0%) | 206 (100.0%) |
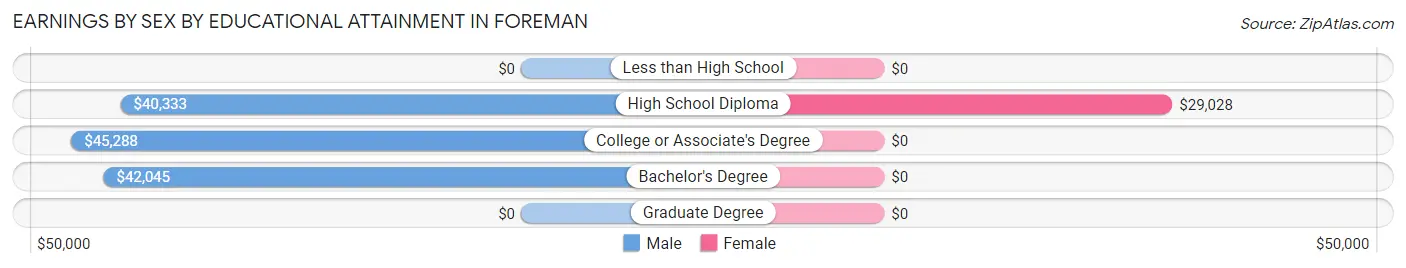
Earnings by Sex by Educational Attainment in Foreman
Average earnings in Foreman are $41,731 for men and $28,750 for women, a difference of 31.1%. Men with an educational attainment of college or associate's degree enjoy the highest average annual earnings of $45,288, while those with high school diploma education earn the least with $40,333. Women with an educational attainment of high school diploma earn the most with the average annual earnings of $29,028, while those with high school diploma education have the smallest earnings of $29,028.
| Educational Attainment | Male Income | Female Income |
| Less than High School | - | - |
| High School Diploma | $40,333 | $29,028 |
| College or Associate's Degree | $45,288 | $0 |
| Bachelor's Degree | $42,045 | $0 |
| Graduate Degree | - | - |
| Total | $41,731 | $28,750 |
Family Income in Foreman
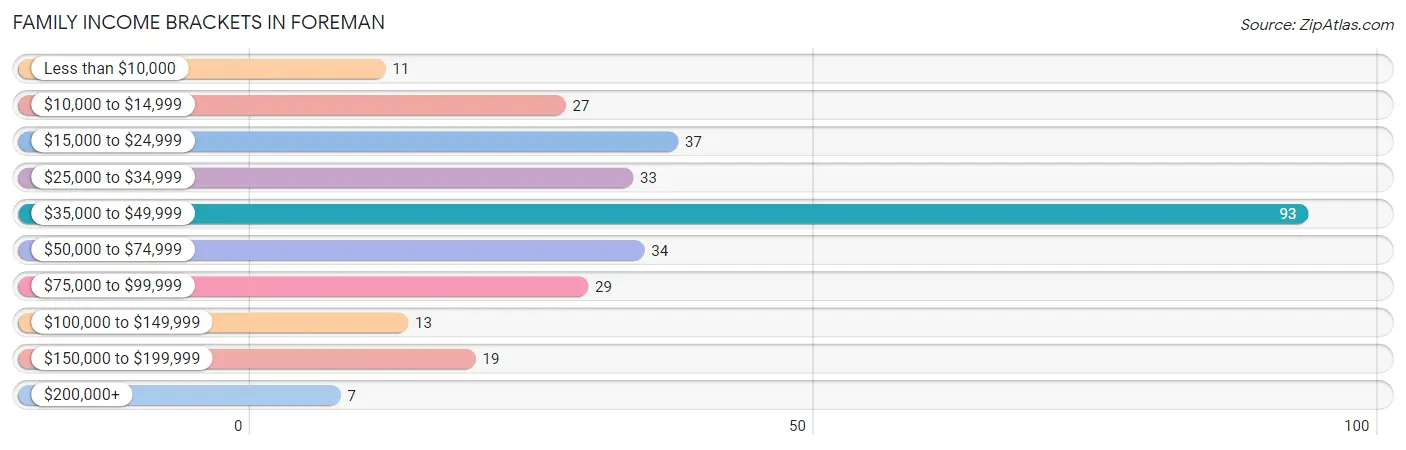
Family Income Brackets in Foreman
According to the Foreman family income data, there are 93 families falling into the $35,000 to $49,999 income range, which is the most common income bracket and makes up 30.7% of all families. Conversely, the $200,000+ income bracket is the least frequent group with only 7 families (2.3%) belonging to this category.
| Income Bracket | # Families | % Families |
| Less than $10,000 | 11 | 3.6% |
| $10,000 to $14,999 | 27 | 8.9% |
| $15,000 to $24,999 | 37 | 12.2% |
| $25,000 to $34,999 | 33 | 10.9% |
| $35,000 to $49,999 | 93 | 30.7% |
| $50,000 to $74,999 | 34 | 11.2% |
| $75,000 to $99,999 | 29 | 9.6% |
| $100,000 to $149,999 | 13 | 4.3% |
| $150,000 to $199,999 | 19 | 6.3% |
| $200,000+ | 7 | 2.3% |
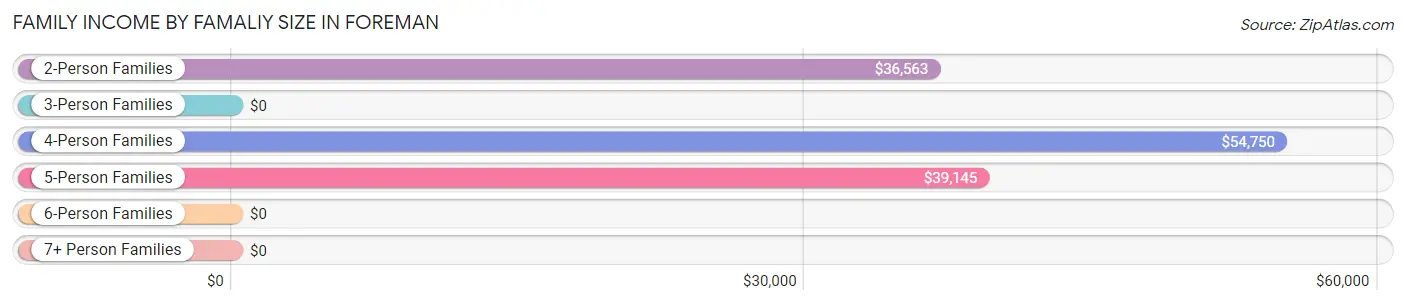
Family Income by Famaliy Size in Foreman
4-person families (39 | 12.9%) account for the highest median family income in Foreman with $54,750 per family, while 2-person families (171 | 56.4%) have the highest median income of $18,282 per family member.
| Income Bracket | # Families | Median Income |
| 2-Person Families | 171 (56.4%) | $36,563 |
| 3-Person Families | 58 (19.1%) | $0 |
| 4-Person Families | 39 (12.9%) | $54,750 |
| 5-Person Families | 25 (8.3%) | $39,145 |
| 6-Person Families | 0 (0.0%) | $0 |
| 7+ Person Families | 10 (3.3%) | $0 |
| Total | 303 (100.0%) | $39,850 |
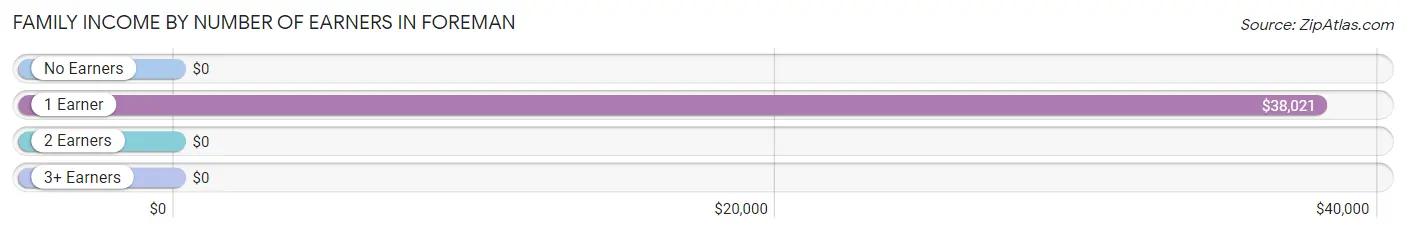
Family Income by Number of Earners in Foreman
| Number of Earners | # Families | Median Income |
| No Earners | 72 (23.8%) | $0 |
| 1 Earner | 155 (51.2%) | $38,021 |
| 2 Earners | 55 (18.1%) | $0 |
| 3+ Earners | 21 (6.9%) | $0 |
| Total | 303 (100.0%) | $39,850 |
Household Income in Foreman
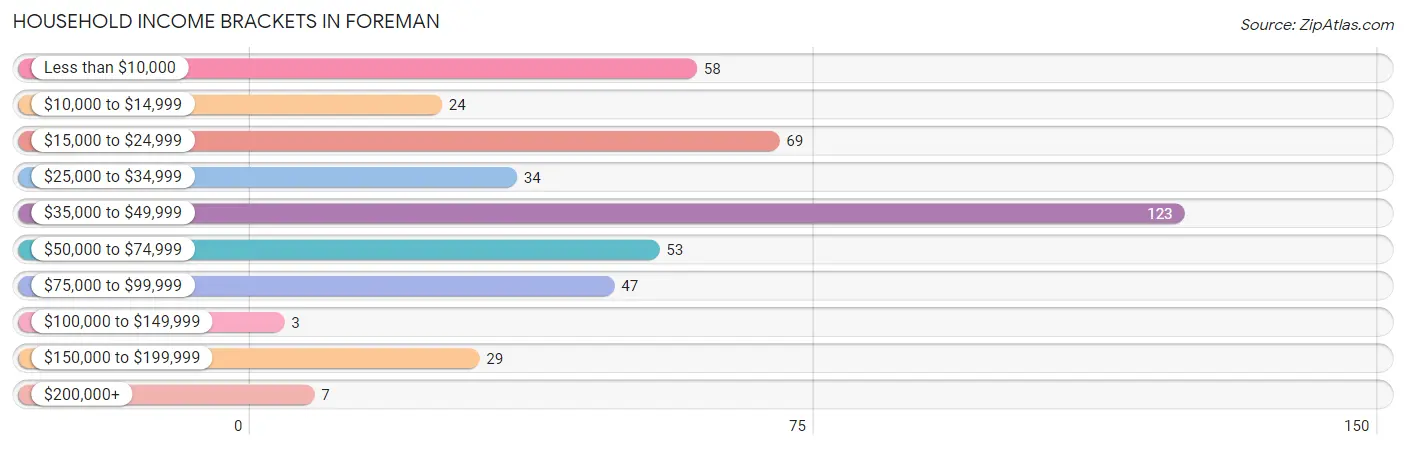
Household Income Brackets in Foreman
With 123 households falling in the category, the $35,000 to $49,999 income range is the most frequent in Foreman, accounting for 27.5% of all households. In contrast, only 3 households (0.7%) fall into the $100,000 to $149,999 income bracket, making it the least populous group.
| Income Bracket | # Households | % Households |
| Less than $10,000 | 58 | 13.0% |
| $10,000 to $14,999 | 24 | 5.4% |
| $15,000 to $24,999 | 69 | 15.4% |
| $25,000 to $34,999 | 34 | 7.6% |
| $35,000 to $49,999 | 123 | 27.5% |
| $50,000 to $74,999 | 53 | 11.9% |
| $75,000 to $99,999 | 47 | 10.5% |
| $100,000 to $149,999 | 3 | 0.7% |
| $150,000 to $199,999 | 29 | 6.5% |
| $200,000+ | 7 | 1.6% |
Household Income by Householder Age in Foreman
The median household income in Foreman is $38,266, with the highest median household income of $41,029 found in the 25 to 44 years age bracket for the primary householder. A total of 114 households (25.5%) fall into this category. Meanwhile, the 15 to 24 years age bracket for the primary householder has the lowest median household income of $0, with 17 households (3.8%) in this group.
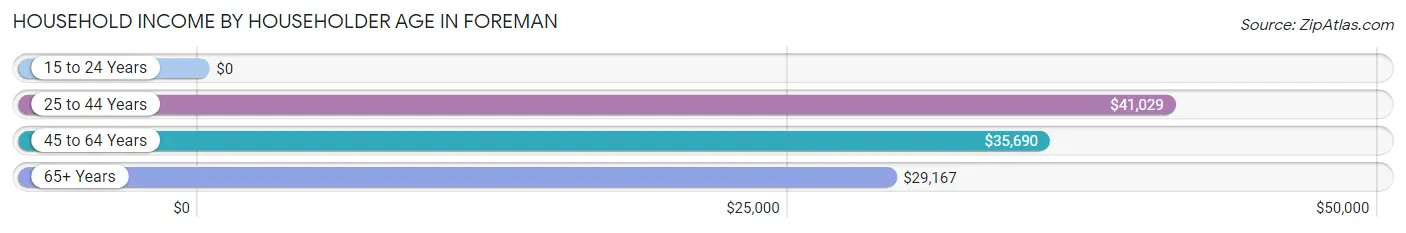
| Income Bracket | # Households | Median Income |
| 15 to 24 Years | 17 (3.8%) | $0 |
| 25 to 44 Years | 114 (25.5%) | $41,029 |
| 45 to 64 Years | 176 (39.4%) | $35,690 |
| 65+ Years | 140 (31.3%) | $29,167 |
| Total | 447 (100.0%) | $38,266 |
Poverty in Foreman
Income Below Poverty by Sex and Age in Foreman
With 17.5% poverty level for males and 23.4% for females among the residents of Foreman, 6 to 11 year old males and 12 to 14 year old females are the most vulnerable to poverty, with 26 males (59.1%) and 22 females (53.7%) in their respective age groups living below the poverty level.
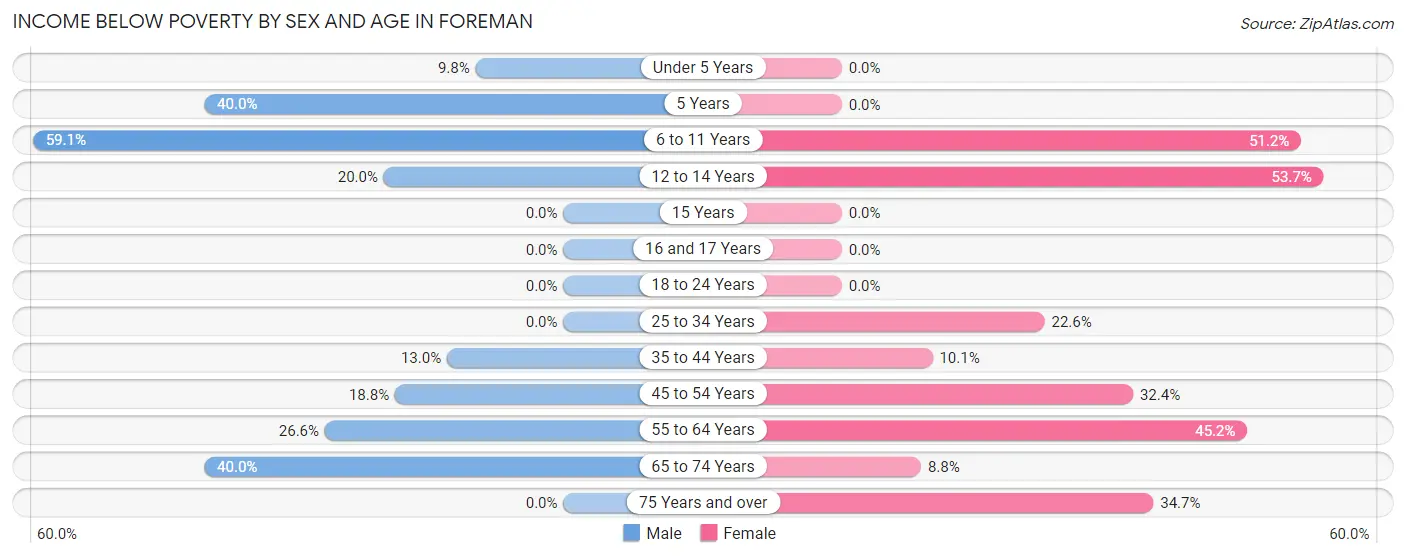
| Age Bracket | Male | Female |
| Under 5 Years | 9 (9.8%) | 0 (0.0%) |
| 5 Years | 4 (40.0%) | 0 (0.0%) |
| 6 to 11 Years | 26 (59.1%) | 22 (51.2%) |
| 12 to 14 Years | 3 (20.0%) | 22 (53.7%) |
| 15 Years | 0 (0.0%) | 0 (0.0%) |
| 16 and 17 Years | 0 (0.0%) | 0 (0.0%) |
| 18 to 24 Years | 0 (0.0%) | 0 (0.0%) |
| 25 to 34 Years | 0 (0.0%) | 14 (22.6%) |
| 35 to 44 Years | 7 (13.0%) | 10 (10.1%) |
| 45 to 54 Years | 9 (18.8%) | 36 (32.4%) |
| 55 to 64 Years | 17 (26.6%) | 28 (45.2%) |
| 65 to 74 Years | 22 (40.0%) | 6 (8.8%) |
| 75 Years and over | 0 (0.0%) | 17 (34.7%) |
| Total | 97 (17.5%) | 155 (23.4%) |
Income Above Poverty by Sex and Age in Foreman
According to the poverty statistics in Foreman, males aged 16 and 17 years and females aged under 5 years are the age groups that are most secure financially, with 100.0% of males and 100.0% of females in these age groups living above the poverty line.
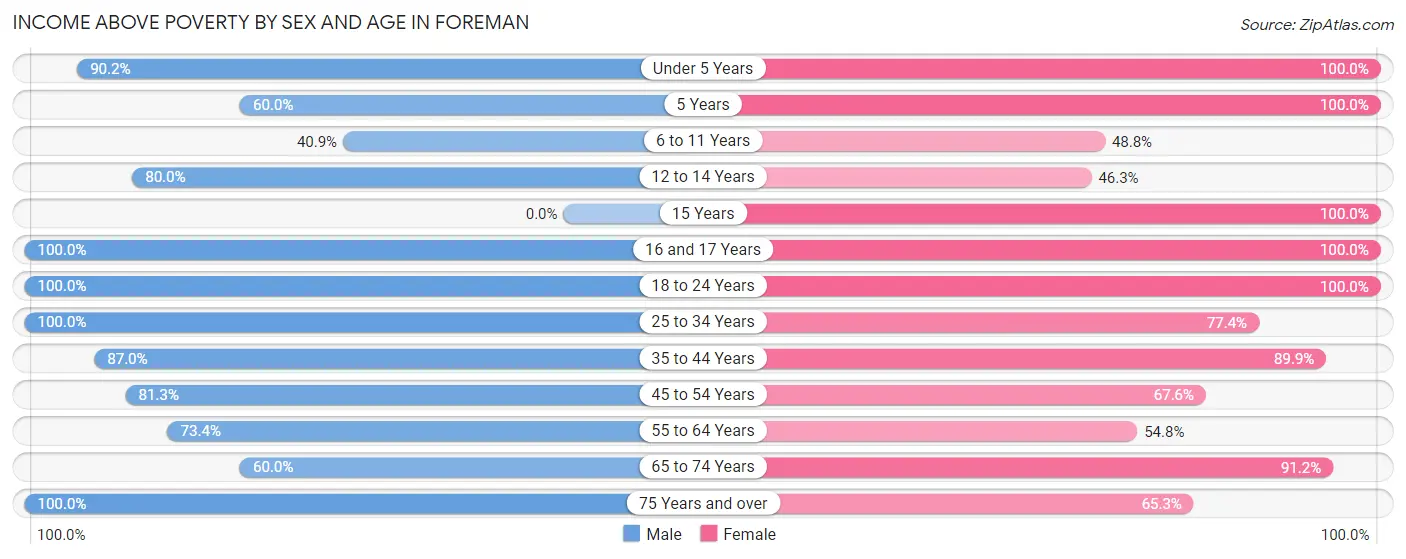
| Age Bracket | Male | Female |
| Under 5 Years | 83 (90.2%) | 12 (100.0%) |
| 5 Years | 6 (60.0%) | 14 (100.0%) |
| 6 to 11 Years | 18 (40.9%) | 21 (48.8%) |
| 12 to 14 Years | 12 (80.0%) | 19 (46.3%) |
| 15 Years | 0 (0.0%) | 22 (100.0%) |
| 16 and 17 Years | 3 (100.0%) | 29 (100.0%) |
| 18 to 24 Years | 62 (100.0%) | 49 (100.0%) |
| 25 to 34 Years | 73 (100.0%) | 48 (77.4%) |
| 35 to 44 Years | 47 (87.0%) | 89 (89.9%) |
| 45 to 54 Years | 39 (81.2%) | 75 (67.6%) |
| 55 to 64 Years | 47 (73.4%) | 34 (54.8%) |
| 65 to 74 Years | 33 (60.0%) | 62 (91.2%) |
| 75 Years and over | 33 (100.0%) | 32 (65.3%) |
| Total | 456 (82.5%) | 506 (76.5%) |
Income Below Poverty Among Married-Couple Families in Foreman
The poverty statistics for married-couple families in Foreman show that 12.3% or 19 of the total 154 families live below the poverty line. Families with no children have the highest poverty rate of 19.2%, comprising of 19 families. On the other hand, families with 1 or 2 children have the lowest poverty rate of 0.0%, which includes 0 families.
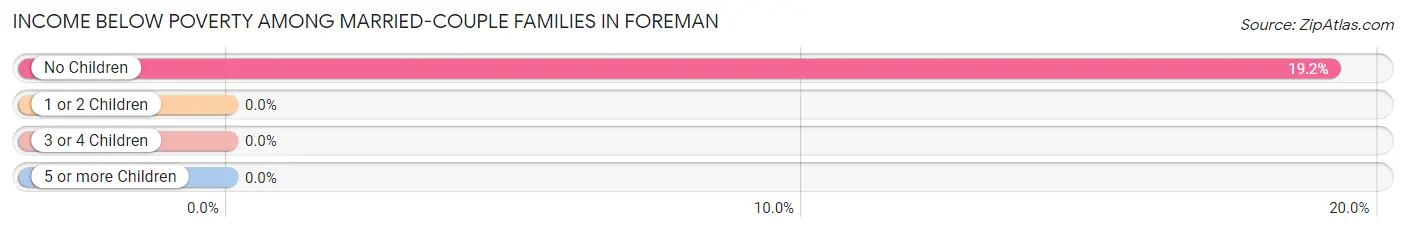
| Children | Above Poverty | Below Poverty |
| No Children | 80 (80.8%) | 19 (19.2%) |
| 1 or 2 Children | 36 (100.0%) | 0 (0.0%) |
| 3 or 4 Children | 19 (100.0%) | 0 (0.0%) |
| 5 or more Children | 0 (0.0%) | 0 (0.0%) |
| Total | 135 (87.7%) | 19 (12.3%) |
Income Below Poverty Among Single-Parent Households in Foreman
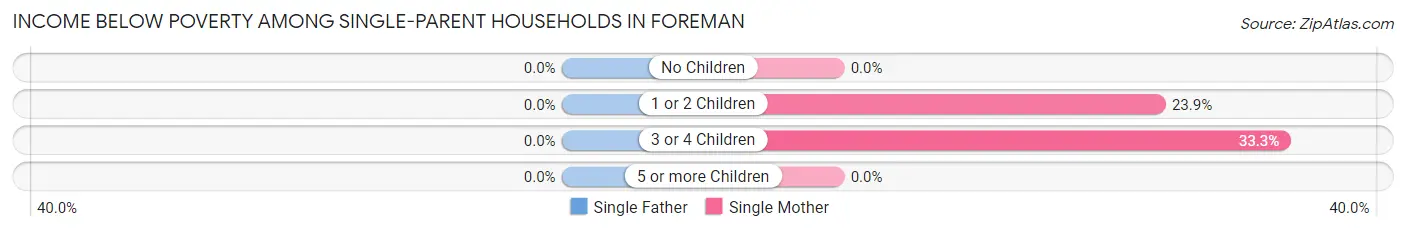
| Children | Single Father | Single Mother |
| No Children | 0 (0.0%) | 0 (0.0%) |
| 1 or 2 Children | 0 (0.0%) | 17 (23.9%) |
| 3 or 4 Children | 0 (0.0%) | 8 (33.3%) |
| 5 or more Children | 0 (0.0%) | 0 (0.0%) |
| Total | 0 (0.0%) | 25 (20.8%) |
Income Below Poverty Among Married-Couple vs Single-Parent Households in Foreman
The poverty data for Foreman shows that 19 of the married-couple family households (12.3%) and 25 of the single-parent households (16.8%) are living below the poverty level. Within the married-couple family households, those with no children have the highest poverty rate, with 19 households (19.2%) falling below the poverty line. Among the single-parent households, those with 3 or 4 children have the highest poverty rate, with 8 household (33.3%) living below poverty.
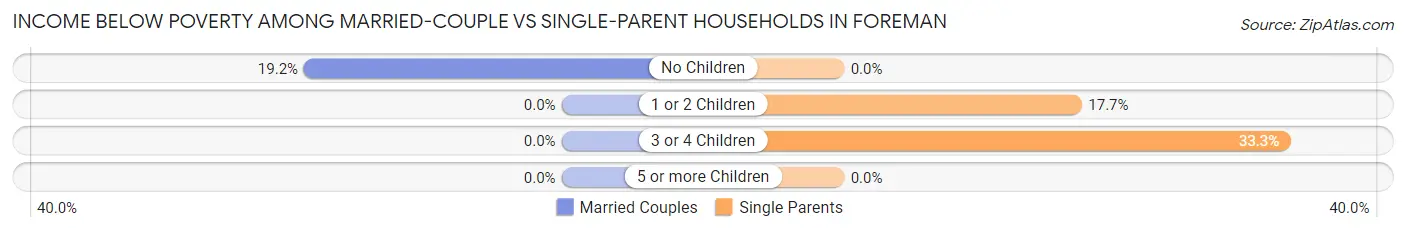
| Children | Married-Couple Families | Single-Parent Households |
| No Children | 19 (19.2%) | 0 (0.0%) |
| 1 or 2 Children | 0 (0.0%) | 17 (17.7%) |
| 3 or 4 Children | 0 (0.0%) | 8 (33.3%) |
| 5 or more Children | 0 (0.0%) | 0 (0.0%) |
| Total | 19 (12.3%) | 25 (16.8%) |
Race in Foreman
The most populous races in Foreman are White / Caucasian (727 | 59.9%), Black / African American (310 | 25.5%), and Hispanic or Latino (175 | 14.4%).
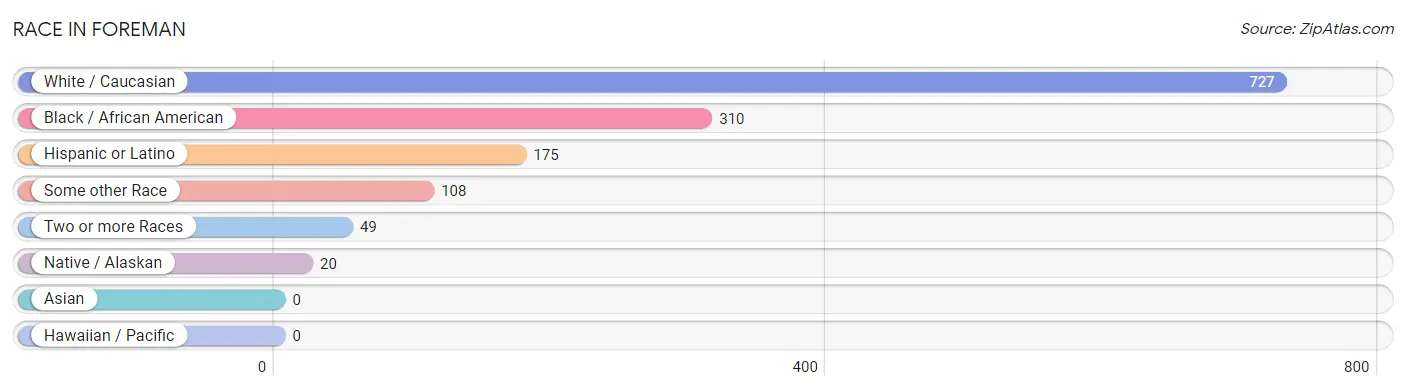
| Race | # Population | % Population |
| Asian | 0 | 0.0% |
| Black / African American | 310 | 25.5% |
| Hawaiian / Pacific | 0 | 0.0% |
| Hispanic or Latino | 175 | 14.4% |
| Native / Alaskan | 20 | 1.7% |
| White / Caucasian | 727 | 59.9% |
| Two or more Races | 49 | 4.0% |
| Some other Race | 108 | 8.9% |
| Total | 1,214 | 100.0% |
Ancestry in Foreman
The most populous ancestries reported in Foreman are Mexican (175 | 14.4%), English (137 | 11.3%), Irish (84 | 6.9%), German (80 | 6.6%), and Italian (39 | 3.2%), together accounting for 42.4% of all Foreman residents.
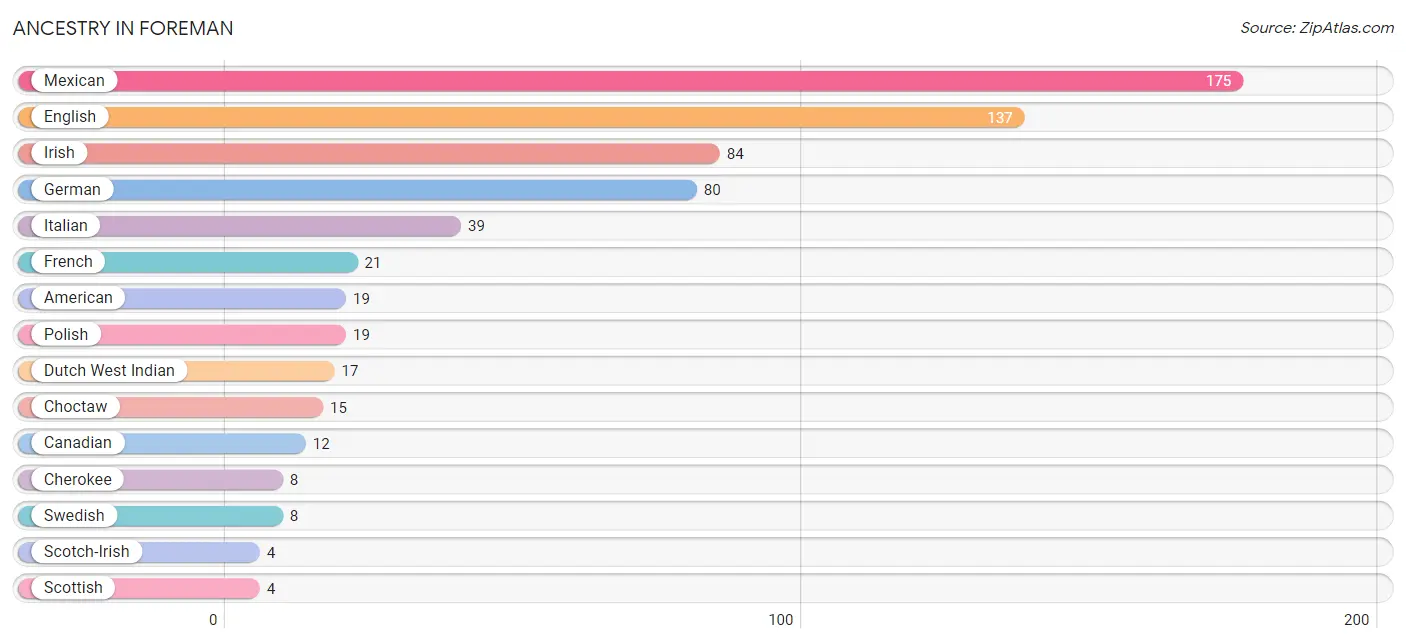
| Ancestry | # Population | % Population |
| American | 19 | 1.6% |
| Canadian | 12 | 1.0% |
| Cherokee | 8 | 0.7% |
| Choctaw | 15 | 1.2% |
| Dutch West Indian | 17 | 1.4% |
| English | 137 | 11.3% |
| French | 21 | 1.7% |
| German | 80 | 6.6% |
| Irish | 84 | 6.9% |
| Italian | 39 | 3.2% |
| Mexican | 175 | 14.4% |
| Polish | 19 | 1.6% |
| Scotch-Irish | 4 | 0.3% |
| Scottish | 4 | 0.3% |
| Swedish | 8 | 0.7% | View All 15 Rows |
Immigrants in Foreman
The most numerous immigrant groups reported in Foreman came from Central America (7 | 0.6%), Latin America (7 | 0.6%), and Mexico (7 | 0.6%), together accounting for 1.7% of all Foreman residents.
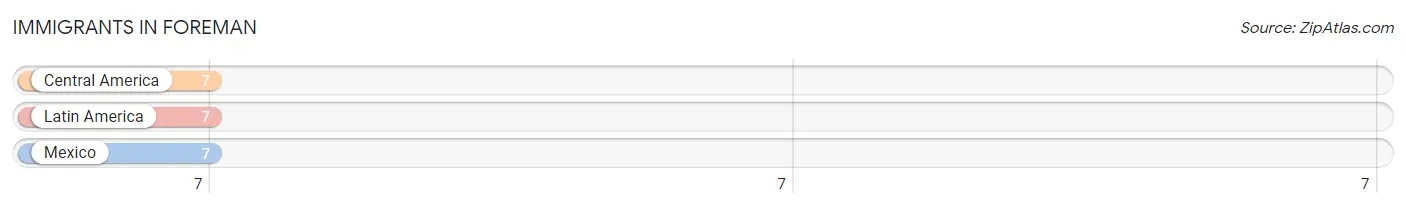
| Immigration Origin | # Population | % Population |
| Central America | 7 | 0.6% |
| Latin America | 7 | 0.6% |
| Mexico | 7 | 0.6% | View All 3 Rows |
Sex and Age in Foreman
Sex and Age in Foreman
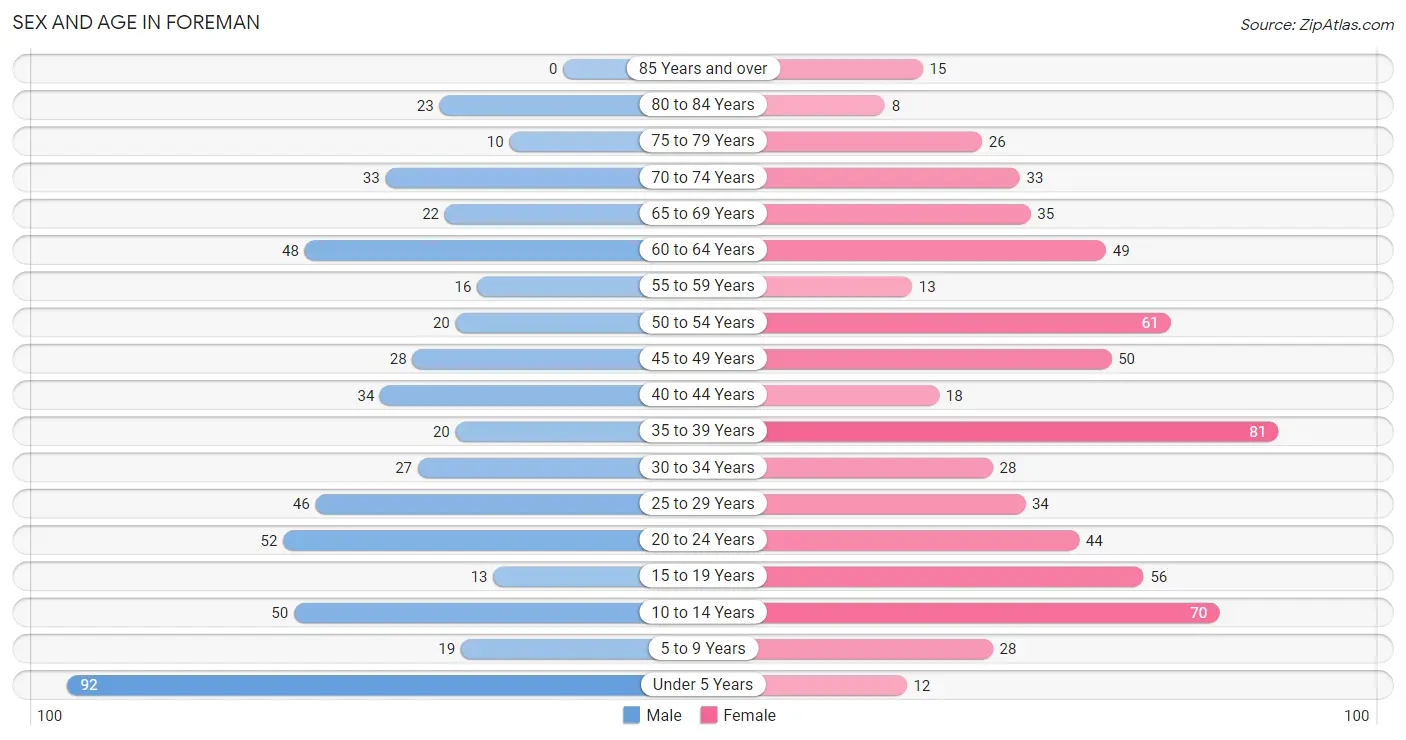
The most populous age groups in Foreman are Under 5 Years (92 | 16.6%) for men and 35 to 39 Years (81 | 12.2%) for women.
| Age Bracket | Male | Female |
| Under 5 Years | 92 (16.6%) | 12 (1.8%) |
| 5 to 9 Years | 19 (3.4%) | 28 (4.2%) |
| 10 to 14 Years | 50 (9.0%) | 70 (10.6%) |
| 15 to 19 Years | 13 (2.4%) | 56 (8.5%) |
| 20 to 24 Years | 52 (9.4%) | 44 (6.7%) |
| 25 to 29 Years | 46 (8.3%) | 34 (5.1%) |
| 30 to 34 Years | 27 (4.9%) | 28 (4.2%) |
| 35 to 39 Years | 20 (3.6%) | 81 (12.2%) |
| 40 to 44 Years | 34 (6.1%) | 18 (2.7%) |
| 45 to 49 Years | 28 (5.1%) | 50 (7.6%) |
| 50 to 54 Years | 20 (3.6%) | 61 (9.2%) |
| 55 to 59 Years | 16 (2.9%) | 13 (2.0%) |
| 60 to 64 Years | 48 (8.7%) | 49 (7.4%) |
| 65 to 69 Years | 22 (4.0%) | 35 (5.3%) |
| 70 to 74 Years | 33 (6.0%) | 33 (5.0%) |
| 75 to 79 Years | 10 (1.8%) | 26 (3.9%) |
| 80 to 84 Years | 23 (4.2%) | 8 (1.2%) |
| 85 Years and over | 0 (0.0%) | 15 (2.3%) |
| Total | 553 (100.0%) | 661 (100.0%) |
Families and Households in Foreman
Median Family Size in Foreman
The median family size in Foreman is 3.08 persons per family, with single female/mother families (120 | 39.6%) accounting for the largest median family size of 3.35 persons per family. On the other hand, married-couple families (154 | 50.8%) represent the smallest median family size with 2.82 persons per family.
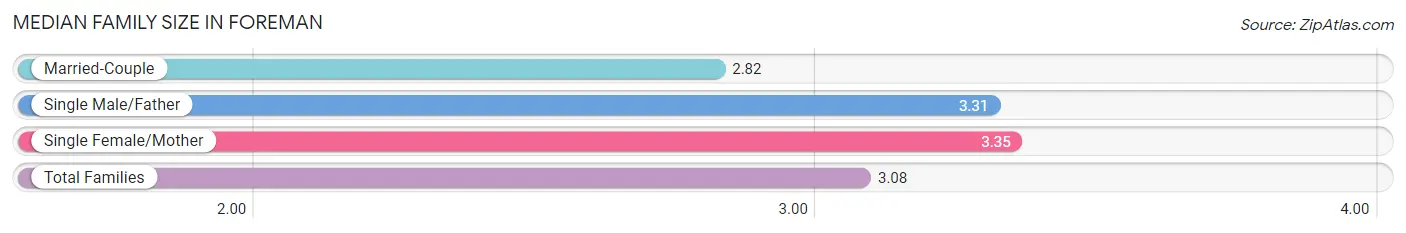
| Family Type | # Families | Family Size |
| Married-Couple | 154 (50.8%) | 2.82 |
| Single Male/Father | 29 (9.6%) | 3.31 |
| Single Female/Mother | 120 (39.6%) | 3.35 |
| Total Families | 303 (100.0%) | 3.08 |
Median Household Size in Foreman
The median household size in Foreman is 2.72 persons per household, with single female/mother households (120 | 26.9%) accounting for the largest median household size of 3.99 persons per household. non-family households (144 | 32.2%) represent the smallest median household size with 1.37 persons per household.
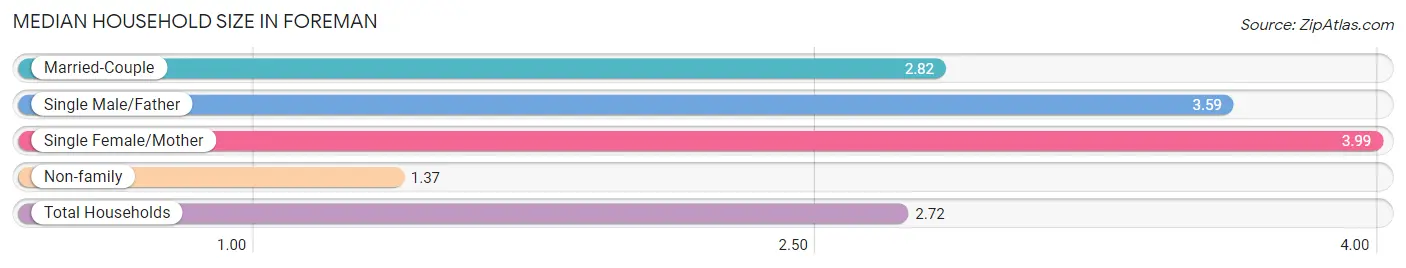
| Household Type | # Households | Household Size |
| Married-Couple | 154 (34.4%) | 2.82 |
| Single Male/Father | 29 (6.5%) | 3.59 |
| Single Female/Mother | 120 (26.9%) | 3.99 |
| Non-family | 144 (32.2%) | 1.37 |
| Total Households | 447 (100.0%) | 2.72 |
Household Size by Marriage Status in Foreman
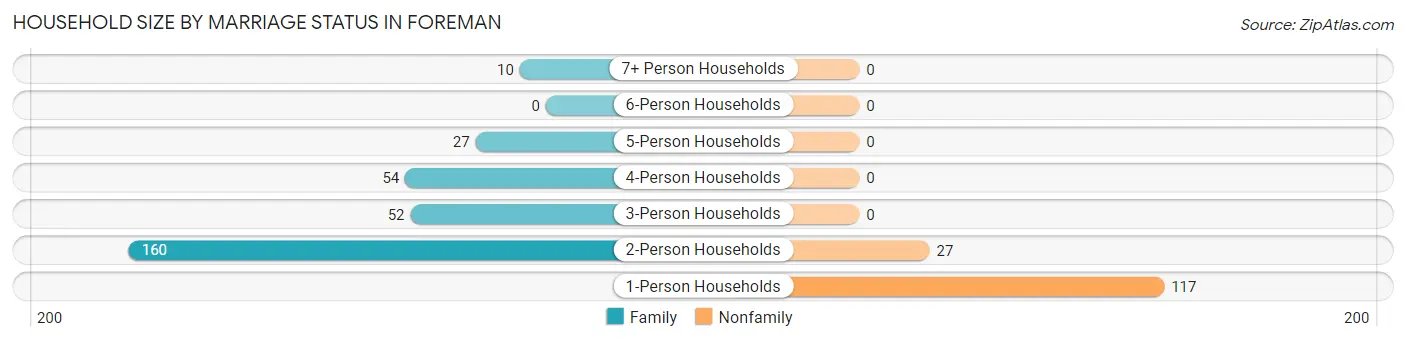
Out of a total of 447 households in Foreman, 303 (67.8%) are family households, while 144 (32.2%) are nonfamily households. The most numerous type of family households are 2-person households, comprising 160, and the most common type of nonfamily households are 1-person households, comprising 117.
| Household Size | Family Households | Nonfamily Households |
| 1-Person Households | - | 117 (26.2%) |
| 2-Person Households | 160 (35.8%) | 27 (6.0%) |
| 3-Person Households | 52 (11.6%) | 0 (0.0%) |
| 4-Person Households | 54 (12.1%) | 0 (0.0%) |
| 5-Person Households | 27 (6.0%) | 0 (0.0%) |
| 6-Person Households | 0 (0.0%) | 0 (0.0%) |
| 7+ Person Households | 10 (2.2%) | 0 (0.0%) |
| Total | 303 (67.8%) | 144 (32.2%) |
Female Fertility in Foreman
Fertility by Age in Foreman
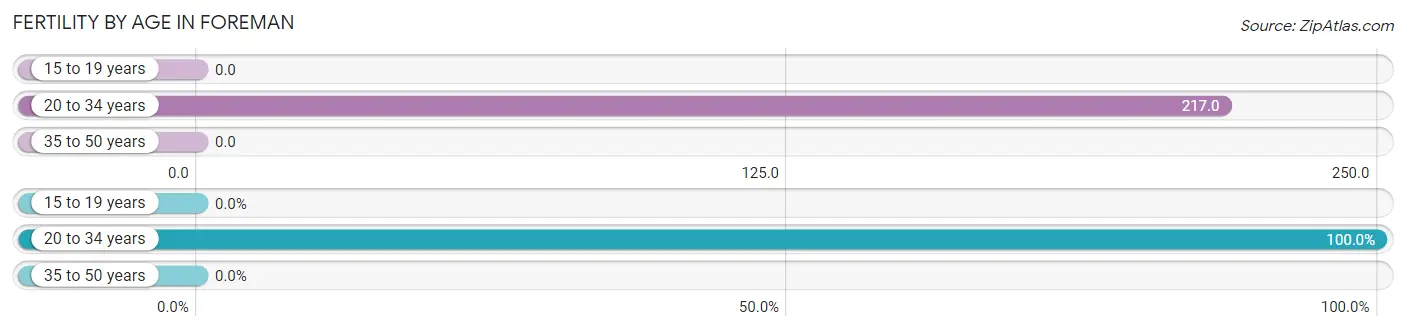
Average fertility rate in Foreman is 73.0 births per 1,000 women. Women in the age bracket of 20 to 34 years have the highest fertility rate with 217.0 births per 1,000 women. Women in the age bracket of 20 to 34 years acount for 100.0% of all women with births.
| Age Bracket | Women with Births | Births / 1,000 Women |
| 15 to 19 years | 0 (0.0%) | 0.0 |
| 20 to 34 years | 23 (100.0%) | 217.0 |
| 35 to 50 years | 0 (0.0%) | 0.0 |
| Total | 23 (100.0%) | 73.0 |
Fertility by Age by Marriage Status in Foreman
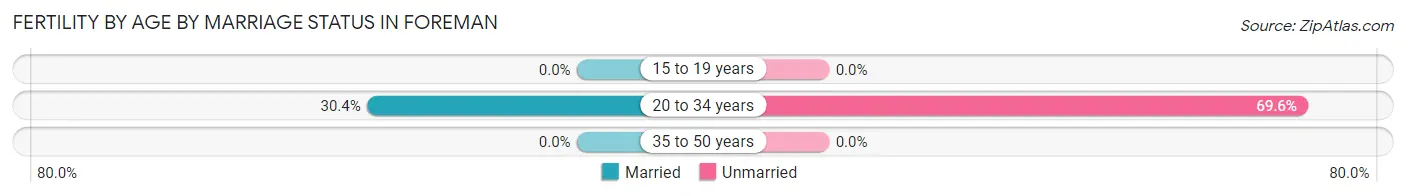
30.4% of women with births (23) in Foreman are married. The highest percentage of unmarried women with births falls into 20 to 34 years age bracket with 69.6% of them unmarried at the time of birth, while the lowest percentage of unmarried women with births belong to 20 to 34 years age bracket with 69.6% of them unmarried.
| Age Bracket | Married | Unmarried |
| 15 to 19 years | 0 (0.0%) | 0 (0.0%) |
| 20 to 34 years | 7 (30.4%) | 16 (69.6%) |
| 35 to 50 years | 0 (0.0%) | 0 (0.0%) |
| Total | 7 (30.4%) | 16 (69.6%) |
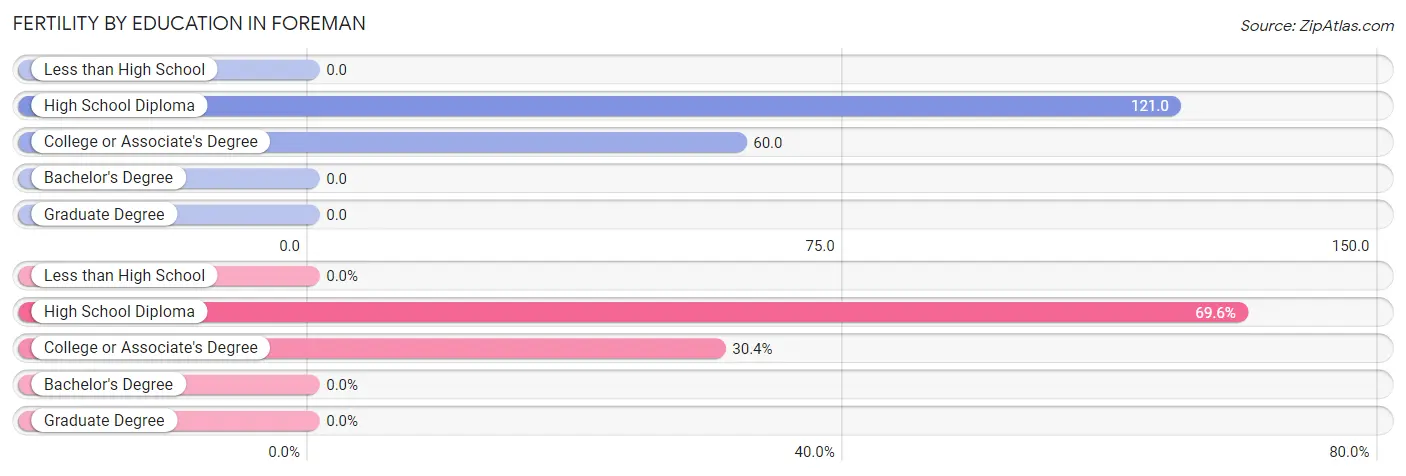
Fertility by Education in Foreman
| Educational Attainment | Women with Births | Births / 1,000 Women |
| Less than High School | 0 (0.0%) | 0.0 |
| High School Diploma | 16 (69.6%) | 121.0 |
| College or Associate's Degree | 7 (30.4%) | 60.0 |
| Bachelor's Degree | 0 (0.0%) | 0.0 |
| Graduate Degree | 0 (0.0%) | 0.0 |
| Total | 23 (100.0%) | 73.0 |
Fertility by Education by Marriage Status in Foreman
69.6% of women with births in Foreman are unmarried. Women with the educational attainment of college or associate's degree are most likely to be married with 100.0% of them married at childbirth, while women with the educational attainment of high school diploma are least likely to be married with 100.0% of them unmarried at childbirth.
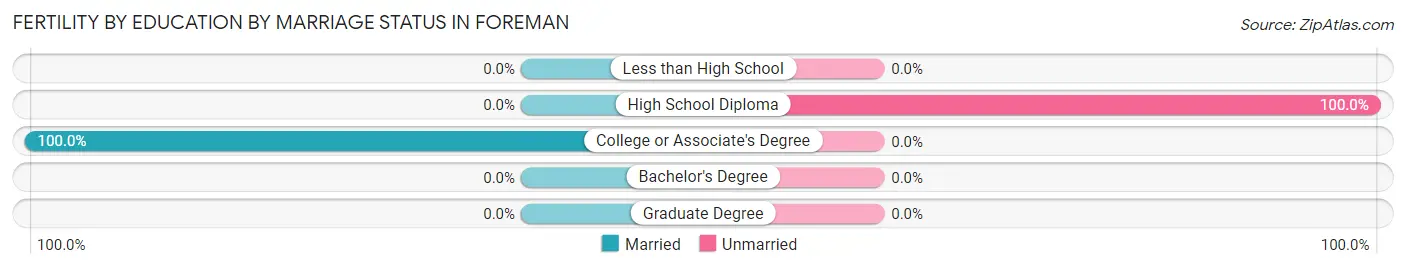
| Educational Attainment | Married | Unmarried |
| Less than High School | 0 (0.0%) | 0 (0.0%) |
| High School Diploma | 0 (0.0%) | 16 (100.0%) |
| College or Associate's Degree | 7 (100.0%) | 0 (0.0%) |
| Bachelor's Degree | 0 (0.0%) | 0 (0.0%) |
| Graduate Degree | 0 (0.0%) | 0 (0.0%) |
| Total | 7 (30.4%) | 16 (69.6%) |
Employment Characteristics in Foreman
Employment by Class of Employer in Foreman
Among the 354 employed individuals in Foreman, private company employees (265 | 74.9%), local government employees (37 | 10.4%), and not-for-profit organizations (27 | 7.6%) make up the most common classes of employment.
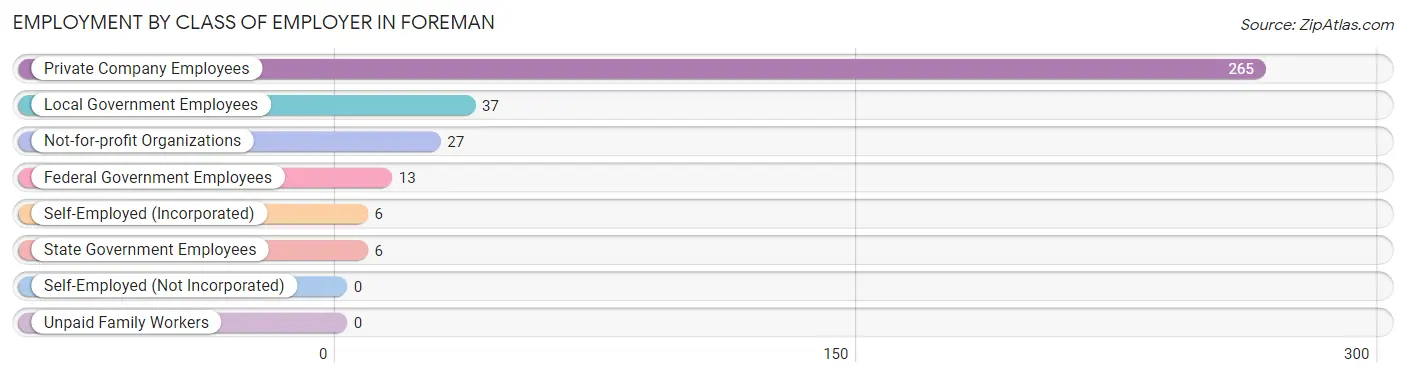
| Employer Class | # Employees | % Employees |
| Private Company Employees | 265 | 74.9% |
| Self-Employed (Incorporated) | 6 | 1.7% |
| Self-Employed (Not Incorporated) | 0 | 0.0% |
| Not-for-profit Organizations | 27 | 7.6% |
| Local Government Employees | 37 | 10.4% |
| State Government Employees | 6 | 1.7% |
| Federal Government Employees | 13 | 3.7% |
| Unpaid Family Workers | 0 | 0.0% |
| Total | 354 | 100.0% |
Employment Status by Age in Foreman
According to the labor force statistics for Foreman, out of the total population over 16 years of age (921), 43.2% or 398 individuals are in the labor force, with 10.8% or 43 of them unemployed. The age group with the highest labor force participation rate is 25 to 29 years, with 90.0% or 72 individuals in the labor force. Within the labor force, the 75 years and over age range has the highest percentage of unemployed individuals, with 100.0% or 2 of them being unemployed.
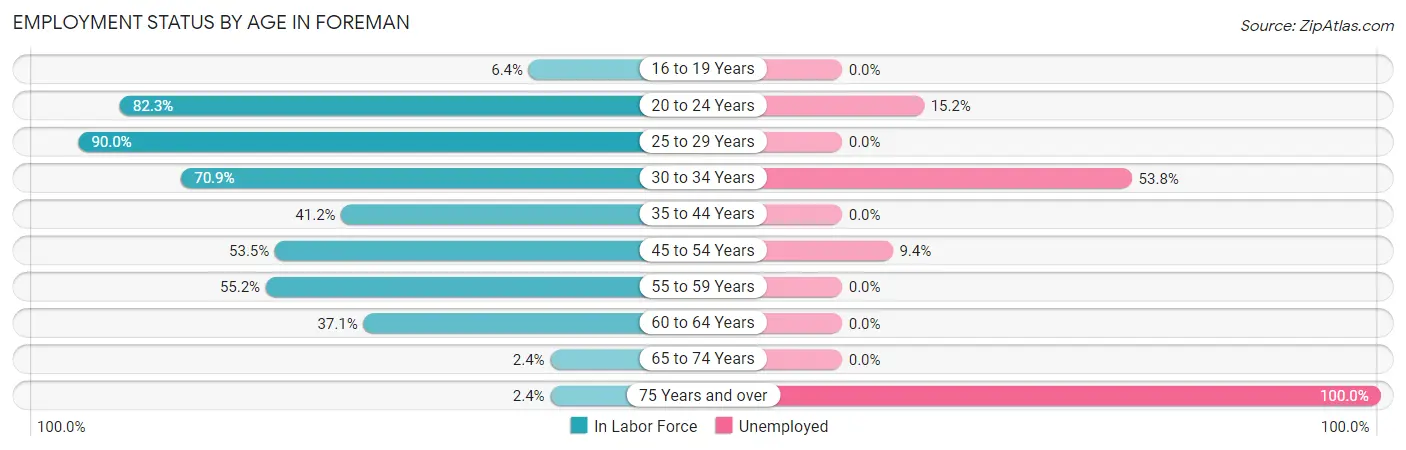
| Age Bracket | In Labor Force | Unemployed |
| 16 to 19 Years | 3 (6.4%) | 0 (0.0%) |
| 20 to 24 Years | 79 (82.3%) | 12 (15.2%) |
| 25 to 29 Years | 72 (90.0%) | 0 (0.0%) |
| 30 to 34 Years | 39 (70.9%) | 21 (53.8%) |
| 35 to 44 Years | 63 (41.2%) | 0 (0.0%) |
| 45 to 54 Years | 85 (53.5%) | 8 (9.4%) |
| 55 to 59 Years | 16 (55.2%) | 0 (0.0%) |
| 60 to 64 Years | 36 (37.1%) | 0 (0.0%) |
| 65 to 74 Years | 3 (2.4%) | 0 (0.0%) |
| 75 Years and over | 2 (2.4%) | 2 (100.0%) |
| Total | 398 (43.2%) | 43 (10.8%) |
Employment Status by Educational Attainment in Foreman
According to labor force statistics for Foreman, 54.3% of individuals (311) out of the total population between 25 and 64 years of age (573) are in the labor force, with 9.3% or 29 of them being unemployed. The group with the highest labor force participation rate are those with the educational attainment of bachelor's degree or higher, with 84.6% or 44 individuals in the labor force. Within the labor force, individuals with bachelor's degree or higher education have the highest percentage of unemployment, with 18.2% or 8 of them being unemployed.
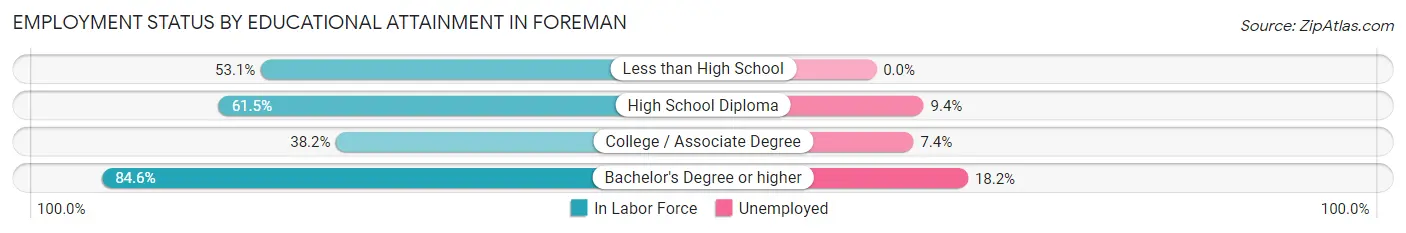
| Educational Attainment | In Labor Force | Unemployed |
| Less than High School | 26 (53.1%) | 0 (0.0%) |
| High School Diploma | 160 (61.5%) | 24 (9.4%) |
| College / Associate Degree | 81 (38.2%) | 16 (7.4%) |
| Bachelor's Degree or higher | 44 (84.6%) | 9 (18.2%) |
| Total | 311 (54.3%) | 53 (9.3%) |
Employment Occupations by Sex in Foreman
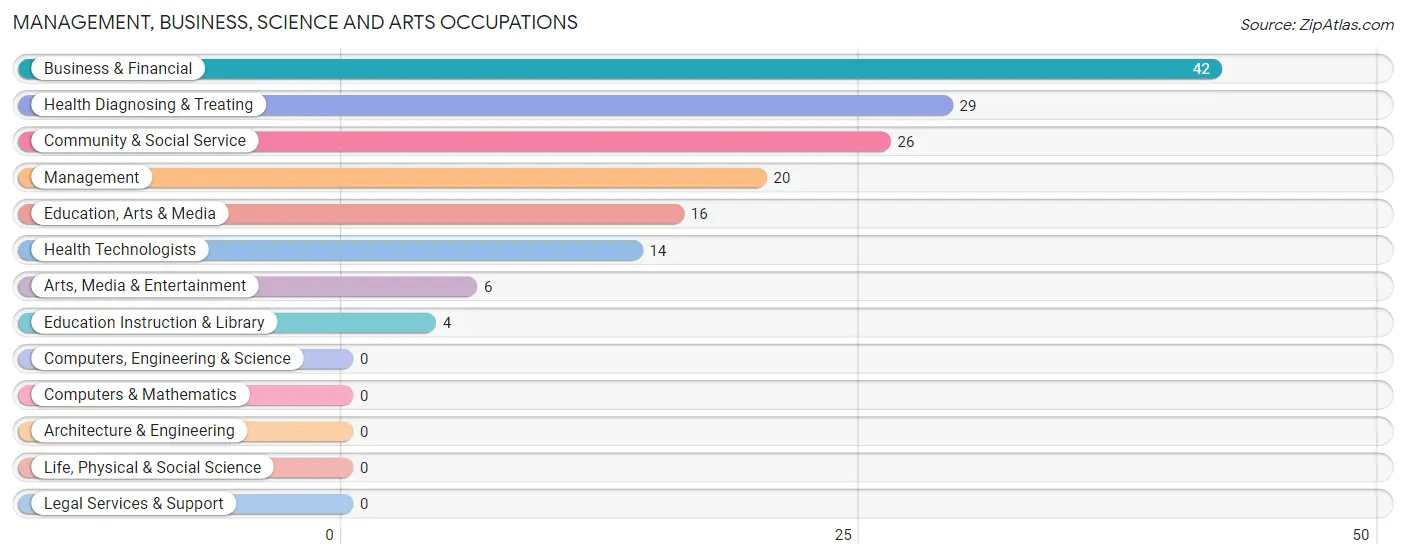
Management, Business, Science and Arts Occupations
The most common Management, Business, Science and Arts occupations in Foreman are Business & Financial (42 | 11.8%), Health Diagnosing & Treating (29 | 8.2%), Community & Social Service (26 | 7.3%), Management (20 | 5.6%), and Education, Arts & Media (16 | 4.5%).
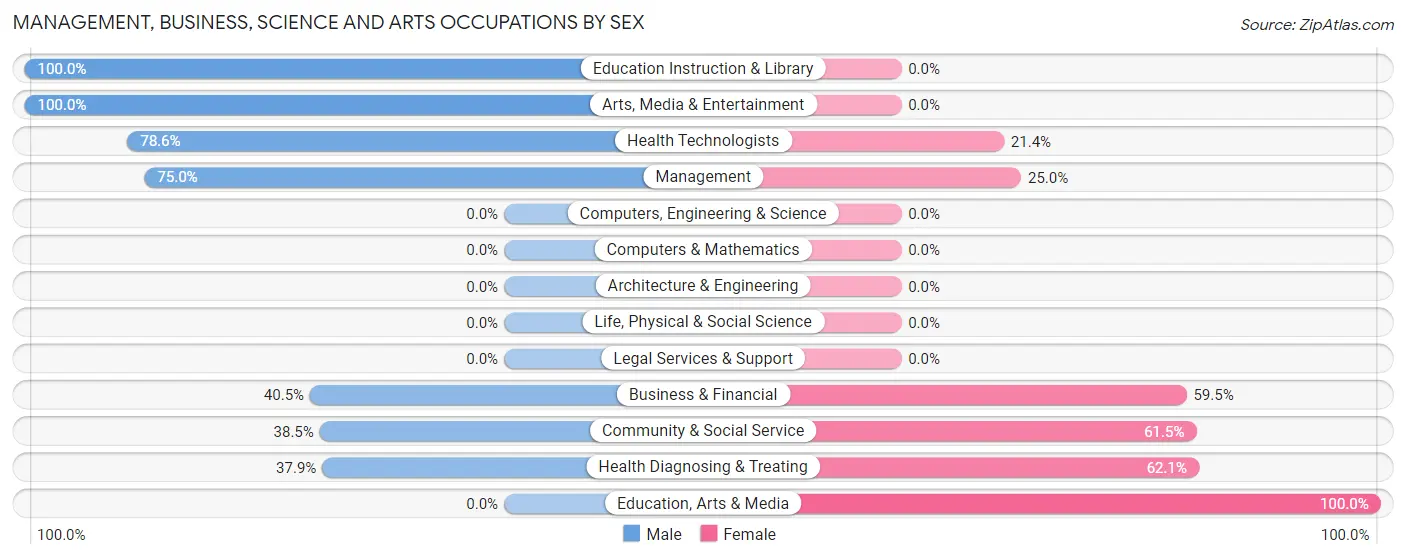
Management, Business, Science and Arts Occupations by Sex
Within the Management, Business, Science and Arts occupations in Foreman, the most male-oriented occupations are Education Instruction & Library (100.0%), Arts, Media & Entertainment (100.0%), and Health Technologists (78.6%), while the most female-oriented occupations are Education, Arts & Media (100.0%), Health Diagnosing & Treating (62.1%), and Community & Social Service (61.5%).
| Occupation | Male | Female |
| Management | 15 (75.0%) | 5 (25.0%) |
| Business & Financial | 17 (40.5%) | 25 (59.5%) |
| Computers, Engineering & Science | 0 (0.0%) | 0 (0.0%) |
| Computers & Mathematics | 0 (0.0%) | 0 (0.0%) |
| Architecture & Engineering | 0 (0.0%) | 0 (0.0%) |
| Life, Physical & Social Science | 0 (0.0%) | 0 (0.0%) |
| Community & Social Service | 10 (38.5%) | 16 (61.5%) |
| Education, Arts & Media | 0 (0.0%) | 16 (100.0%) |
| Legal Services & Support | 0 (0.0%) | 0 (0.0%) |
| Education Instruction & Library | 4 (100.0%) | 0 (0.0%) |
| Arts, Media & Entertainment | 6 (100.0%) | 0 (0.0%) |
| Health Diagnosing & Treating | 11 (37.9%) | 18 (62.1%) |
| Health Technologists | 11 (78.6%) | 3 (21.4%) |
| Total (Category) | 53 (45.3%) | 64 (54.7%) |
| Total (Overall) | 211 (59.4%) | 144 (40.6%) |
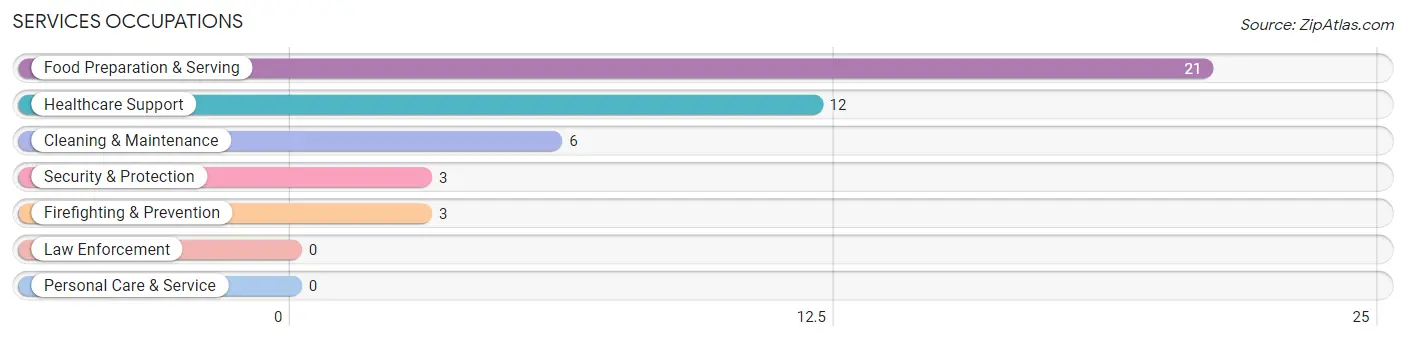
Services Occupations
The most common Services occupations in Foreman are Food Preparation & Serving (21 | 5.9%), Healthcare Support (12 | 3.4%), Cleaning & Maintenance (6 | 1.7%), Security & Protection (3 | 0.9%), and Firefighting & Prevention (3 | 0.9%).
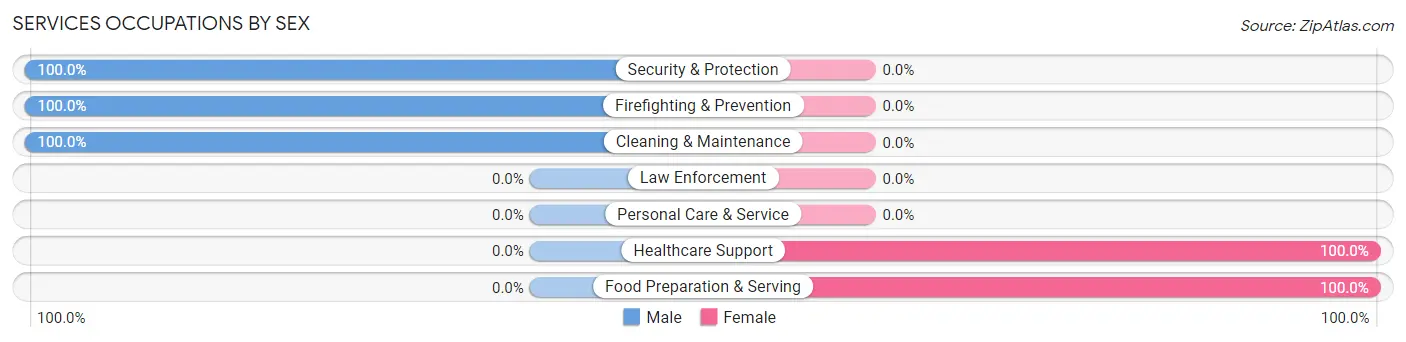
Services Occupations by Sex
Within the Services occupations in Foreman, the most male-oriented occupations are Security & Protection (100.0%), Firefighting & Prevention (100.0%), and Cleaning & Maintenance (100.0%), while the most female-oriented occupations are Healthcare Support (100.0%), and Food Preparation & Serving (100.0%).
| Occupation | Male | Female |
| Healthcare Support | 0 (0.0%) | 12 (100.0%) |
| Security & Protection | 3 (100.0%) | 0 (0.0%) |
| Firefighting & Prevention | 3 (100.0%) | 0 (0.0%) |
| Law Enforcement | 0 (0.0%) | 0 (0.0%) |
| Food Preparation & Serving | 0 (0.0%) | 21 (100.0%) |
| Cleaning & Maintenance | 6 (100.0%) | 0 (0.0%) |
| Personal Care & Service | 0 (0.0%) | 0 (0.0%) |
| Total (Category) | 9 (21.4%) | 33 (78.6%) |
| Total (Overall) | 211 (59.4%) | 144 (40.6%) |
Sales and Office Occupations
The most common Sales and Office occupations in Foreman are , and Office & Administration (16 | 4.5%).
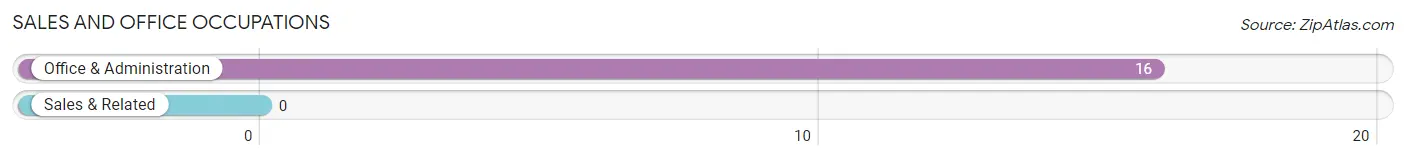
Sales and Office Occupations by Sex
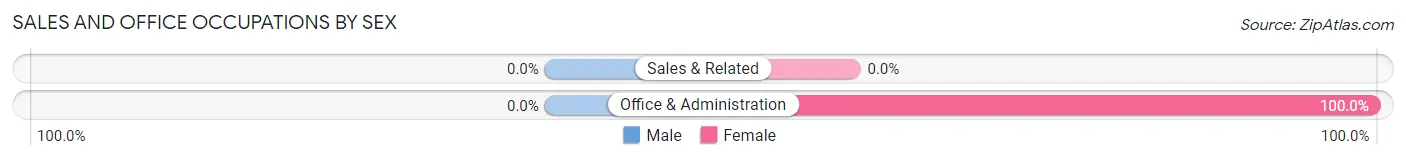
| Occupation | Male | Female |
| Sales & Related | 0 (0.0%) | 0 (0.0%) |
| Office & Administration | 0 (0.0%) | 16 (100.0%) |
| Total (Category) | 0 (0.0%) | 16 (100.0%) |
| Total (Overall) | 211 (59.4%) | 144 (40.6%) |
Natural Resources, Construction and Maintenance Occupations
The most common Natural Resources, Construction and Maintenance occupations in Foreman are Construction & Extraction (45 | 12.7%), Installation, Maintenance & Repair (29 | 8.2%), and Farming, Fishing & Forestry (21 | 5.9%).
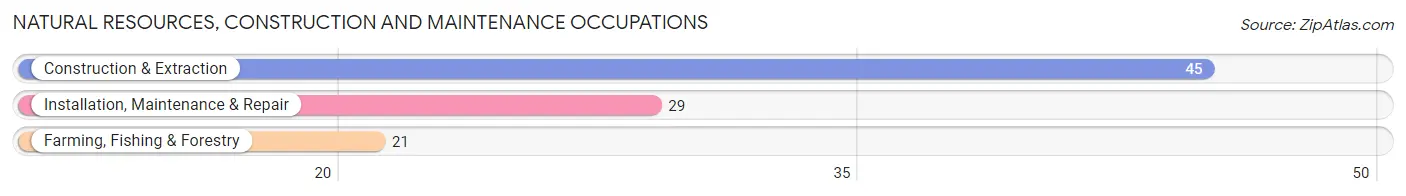
Natural Resources, Construction and Maintenance Occupations by Sex
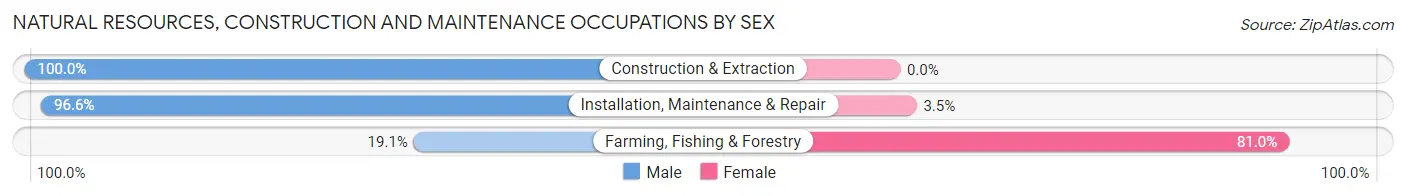
| Occupation | Male | Female |
| Farming, Fishing & Forestry | 4 (19.1%) | 17 (80.9%) |
| Construction & Extraction | 45 (100.0%) | 0 (0.0%) |
| Installation, Maintenance & Repair | 28 (96.6%) | 1 (3.5%) |
| Total (Category) | 77 (81.0%) | 18 (19.0%) |
| Total (Overall) | 211 (59.4%) | 144 (40.6%) |
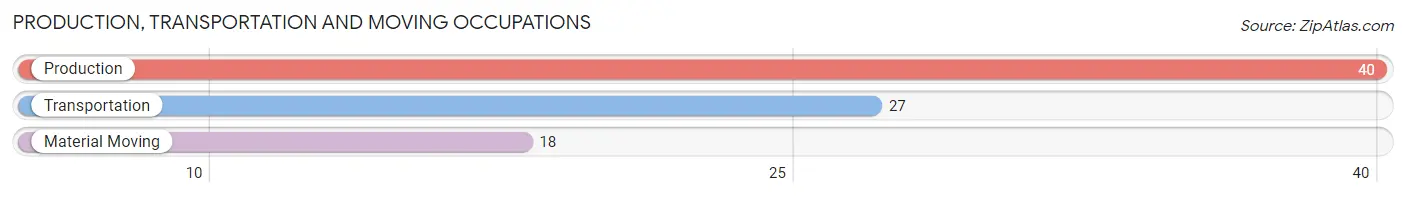
Production, Transportation and Moving Occupations
The most common Production, Transportation and Moving occupations in Foreman are Production (40 | 11.3%), Transportation (27 | 7.6%), and Material Moving (18 | 5.1%).
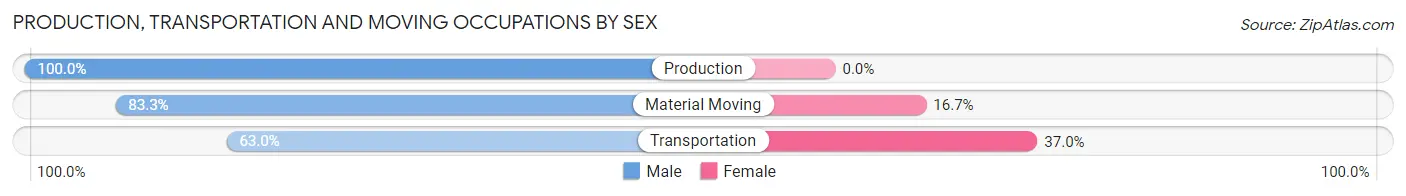
Production, Transportation and Moving Occupations by Sex
| Occupation | Male | Female |
| Production | 40 (100.0%) | 0 (0.0%) |
| Transportation | 17 (63.0%) | 10 (37.0%) |
| Material Moving | 15 (83.3%) | 3 (16.7%) |
| Total (Category) | 72 (84.7%) | 13 (15.3%) |
| Total (Overall) | 211 (59.4%) | 144 (40.6%) |
Employment Industries by Sex in Foreman
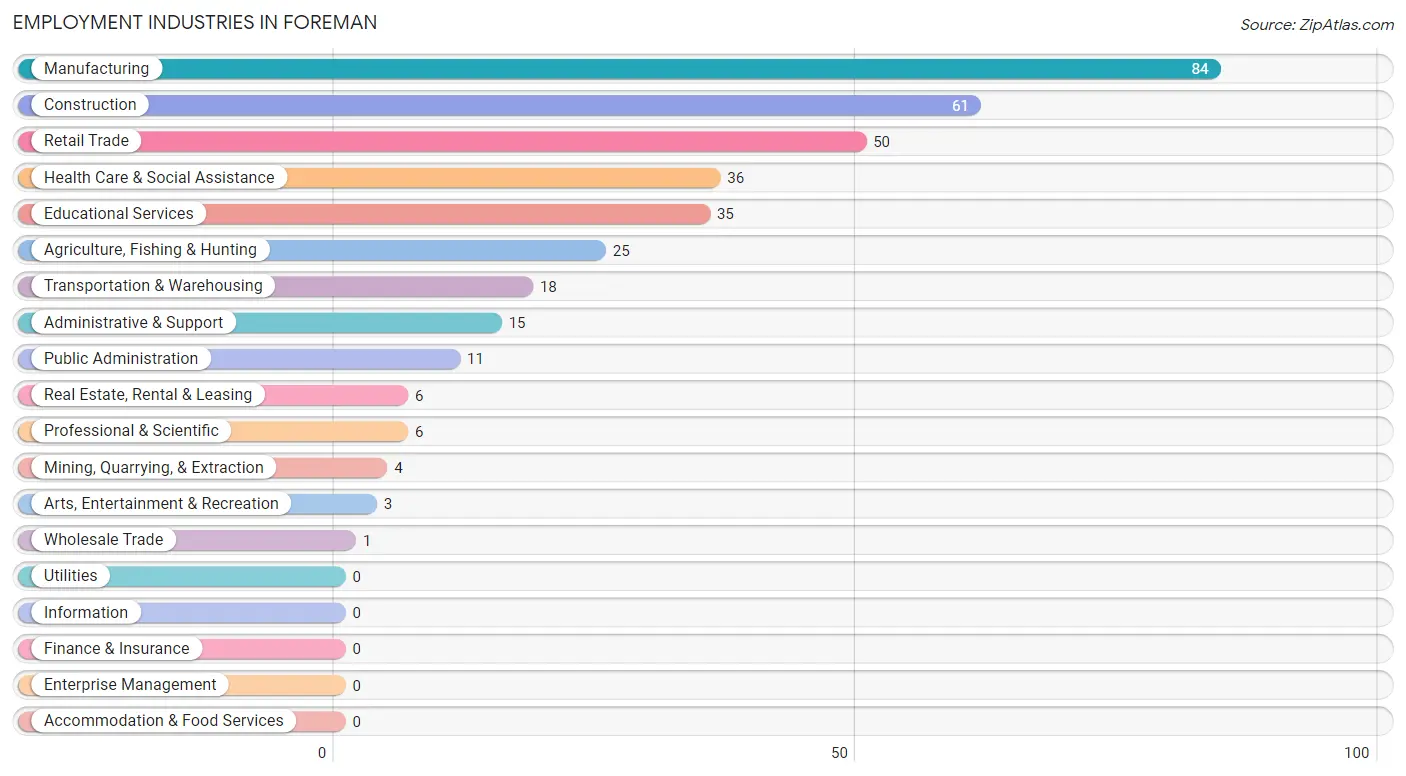
Employment Industries in Foreman
The major employment industries in Foreman include Manufacturing (84 | 23.7%), Construction (61 | 17.2%), Retail Trade (50 | 14.1%), Health Care & Social Assistance (36 | 10.1%), and Educational Services (35 | 9.9%).
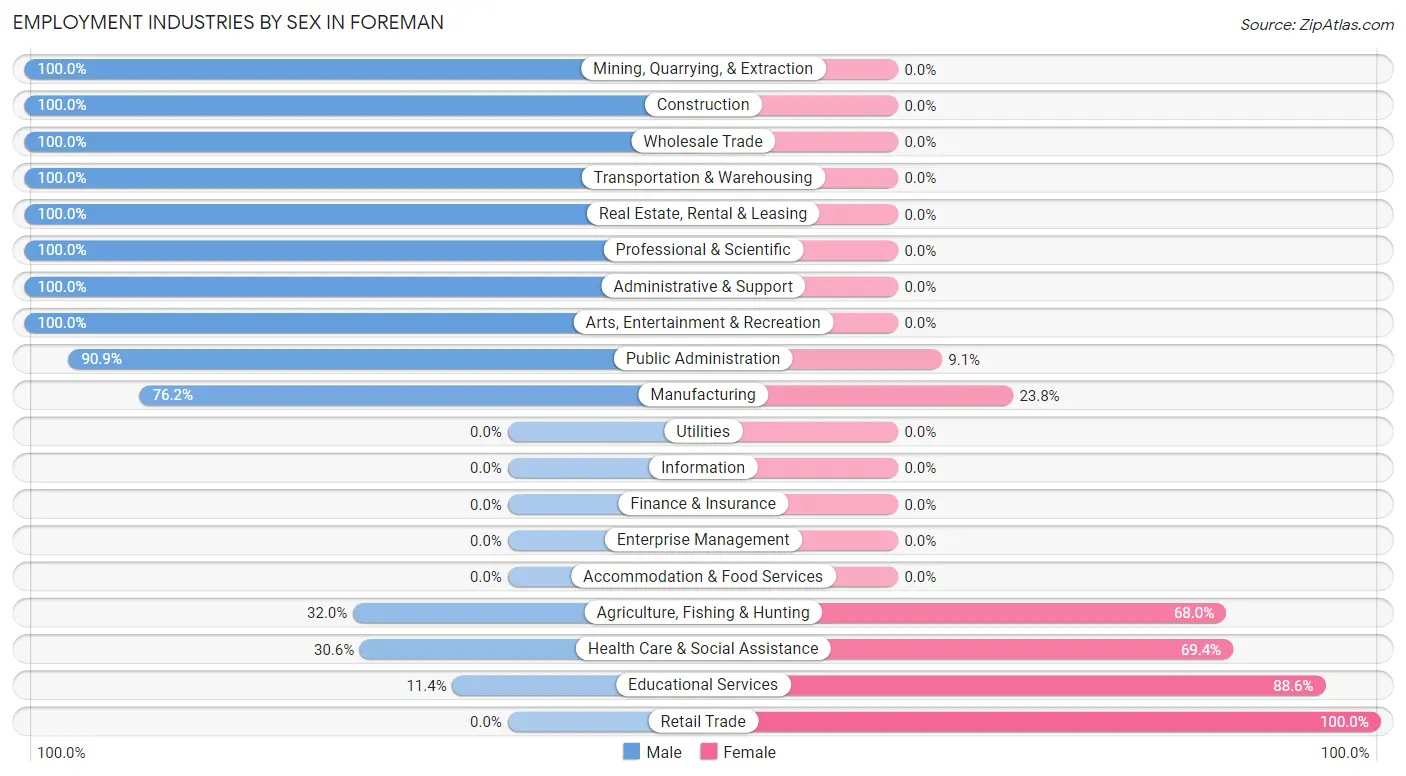
Employment Industries by Sex in Foreman
The Foreman industries that see more men than women are Mining, Quarrying, & Extraction (100.0%), Construction (100.0%), and Wholesale Trade (100.0%), whereas the industries that tend to have a higher number of women are Retail Trade (100.0%), Educational Services (88.6%), and Health Care & Social Assistance (69.4%).
| Industry | Male | Female |
| Agriculture, Fishing & Hunting | 8 (32.0%) | 17 (68.0%) |
| Mining, Quarrying, & Extraction | 4 (100.0%) | 0 (0.0%) |
| Construction | 61 (100.0%) | 0 (0.0%) |
| Manufacturing | 64 (76.2%) | 20 (23.8%) |
| Wholesale Trade | 1 (100.0%) | 0 (0.0%) |
| Retail Trade | 0 (0.0%) | 50 (100.0%) |
| Transportation & Warehousing | 18 (100.0%) | 0 (0.0%) |
| Utilities | 0 (0.0%) | 0 (0.0%) |
| Information | 0 (0.0%) | 0 (0.0%) |
| Finance & Insurance | 0 (0.0%) | 0 (0.0%) |
| Real Estate, Rental & Leasing | 6 (100.0%) | 0 (0.0%) |
| Professional & Scientific | 6 (100.0%) | 0 (0.0%) |
| Enterprise Management | 0 (0.0%) | 0 (0.0%) |
| Administrative & Support | 15 (100.0%) | 0 (0.0%) |
| Educational Services | 4 (11.4%) | 31 (88.6%) |
| Health Care & Social Assistance | 11 (30.6%) | 25 (69.4%) |
| Arts, Entertainment & Recreation | 3 (100.0%) | 0 (0.0%) |
| Accommodation & Food Services | 0 (0.0%) | 0 (0.0%) |
| Public Administration | 10 (90.9%) | 1 (9.1%) |
| Total | 211 (59.4%) | 144 (40.6%) |
Education in Foreman
School Enrollment in Foreman
The most common levels of schooling among the 234 students in Foreman are middle school (104 | 44.4%), high school (61 | 26.1%), and elementary school (34 | 14.5%).
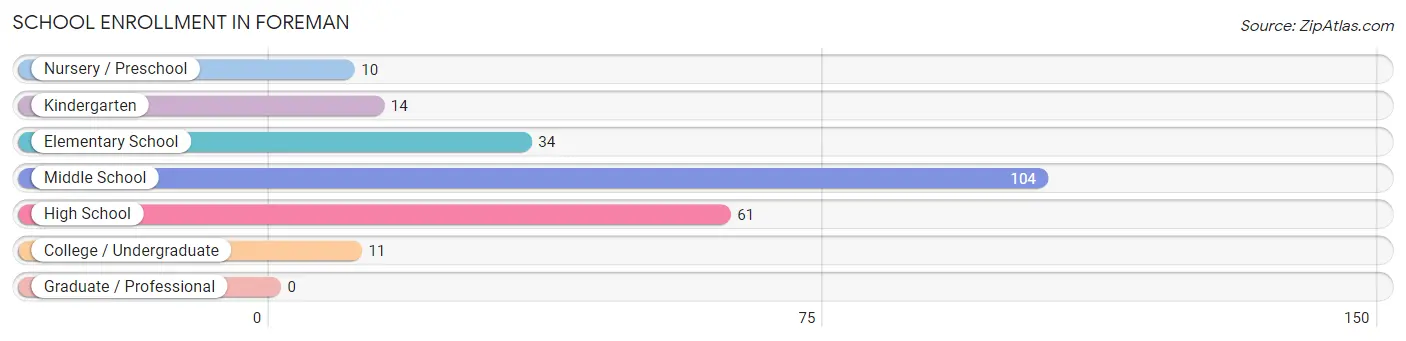
| School Level | # Students | % Students |
| Nursery / Preschool | 10 | 4.3% |
| Kindergarten | 14 | 6.0% |
| Elementary School | 34 | 14.5% |
| Middle School | 104 | 44.4% |
| High School | 61 | 26.1% |
| College / Undergraduate | 11 | 4.7% |
| Graduate / Professional | 0 | 0.0% |
| Total | 234 | 100.0% |
School Enrollment by Age by Funding Source in Foreman
Out of a total of 234 students who are enrolled in schools in Foreman, 5 (2.1%) attend a private institution, while the remaining 229 (97.9%) are enrolled in public schools. The age group of 10 to 14 year olds has the highest likelihood of being enrolled in private schools, with 5 (4.2% in the age bracket) enrolled. Conversely, the age group of 5 to 9 year old has the lowest likelihood of being enrolled in a private school, with 47 (100.0% in the age bracket) attending a public institution.
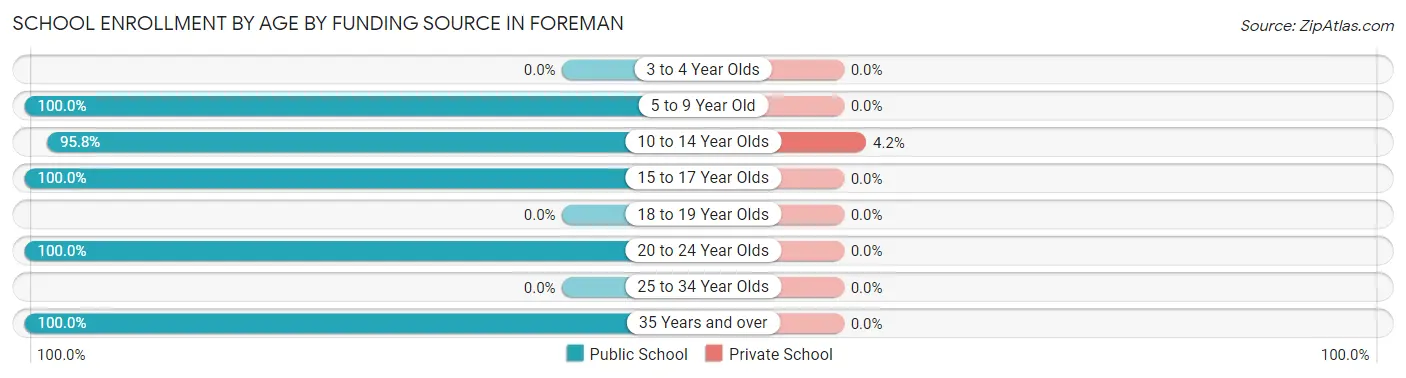
| Age Bracket | Public School | Private School |
| 3 to 4 Year Olds | 0 (0.0%) | 0 (0.0%) |
| 5 to 9 Year Old | 47 (100.0%) | 0 (0.0%) |
| 10 to 14 Year Olds | 115 (95.8%) | 5 (4.2%) |
| 15 to 17 Year Olds | 54 (100.0%) | 0 (0.0%) |
| 18 to 19 Year Olds | 0 (0.0%) | 0 (0.0%) |
| 20 to 24 Year Olds | 11 (100.0%) | 0 (0.0%) |
| 25 to 34 Year Olds | 0 (0.0%) | 0 (0.0%) |
| 35 Years and over | 2 (100.0%) | 0 (0.0%) |
| Total | 229 (97.9%) | 5 (2.1%) |
Educational Attainment by Field of Study in Foreman
Science & technology (30 | 47.6%), business (17 | 27.0%), physical & health sciences (8 | 12.7%), education (5 | 7.9%), and computers & mathematics (3 | 4.8%) are the most common fields of study among 63 individuals in Foreman who have obtained a bachelor's degree or higher.
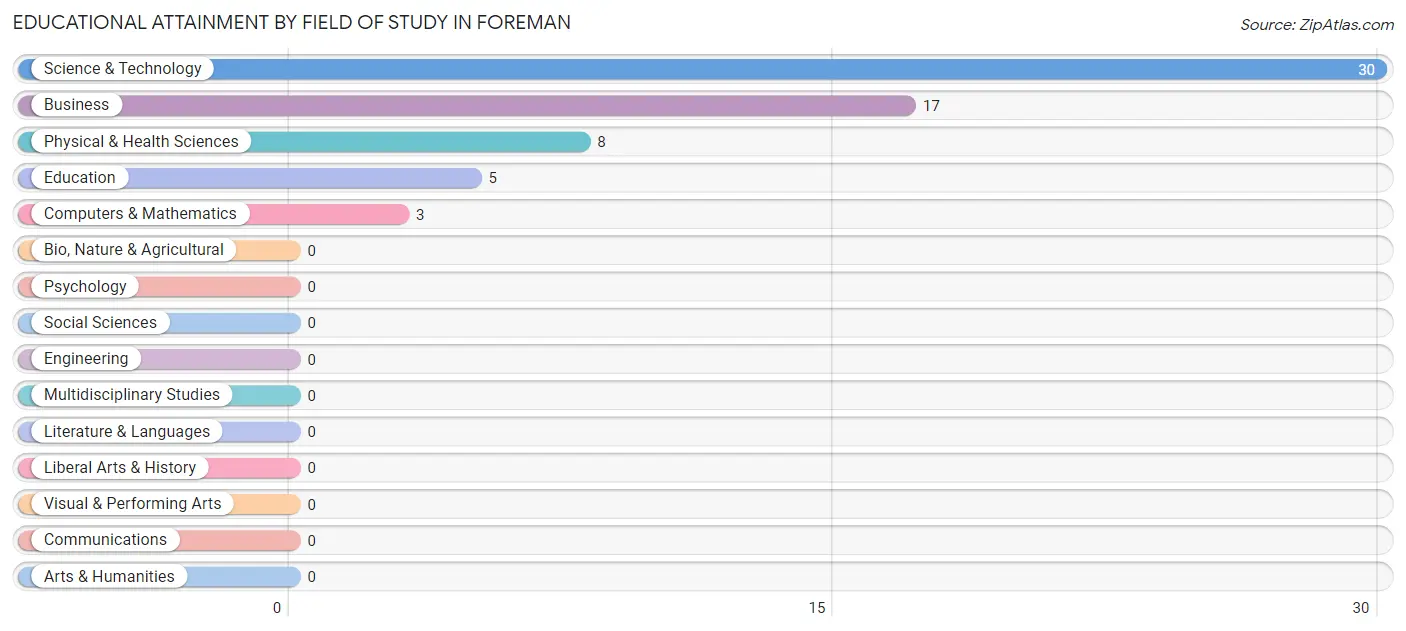
| Field of Study | # Graduates | % Graduates |
| Computers & Mathematics | 3 | 4.8% |
| Bio, Nature & Agricultural | 0 | 0.0% |
| Physical & Health Sciences | 8 | 12.7% |
| Psychology | 0 | 0.0% |
| Social Sciences | 0 | 0.0% |
| Engineering | 0 | 0.0% |
| Multidisciplinary Studies | 0 | 0.0% |
| Science & Technology | 30 | 47.6% |
| Business | 17 | 27.0% |
| Education | 5 | 7.9% |
| Literature & Languages | 0 | 0.0% |
| Liberal Arts & History | 0 | 0.0% |
| Visual & Performing Arts | 0 | 0.0% |
| Communications | 0 | 0.0% |
| Arts & Humanities | 0 | 0.0% |
| Total | 63 | 100.0% |
Transportation & Commute in Foreman
Vehicle Availability by Sex in Foreman
The most prevalent vehicle ownership categories in Foreman are males with 3 vehicles (100, accounting for 47.4%) and females with 3 vehicles (73, making up 69.9%).
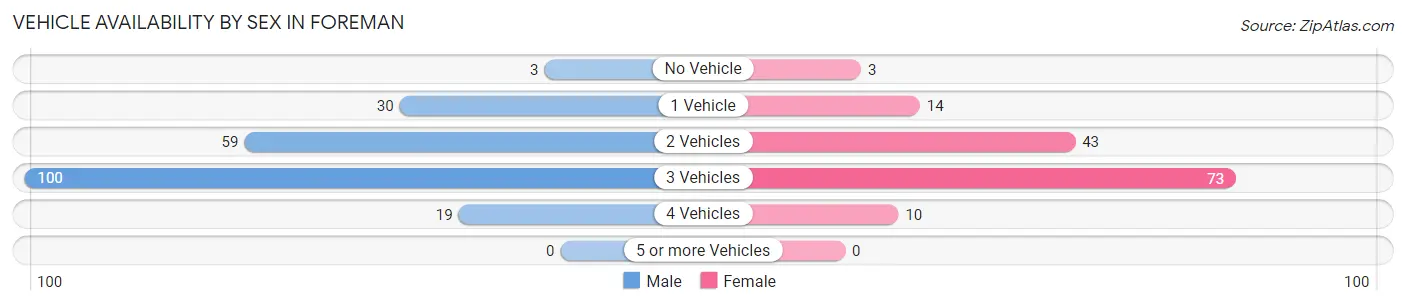
| Vehicles Available | Male | Female |
| No Vehicle | 3 (1.4%) | 3 (2.1%) |
| 1 Vehicle | 30 (14.2%) | 14 (9.8%) |
| 2 Vehicles | 59 (28.0%) | 43 (30.1%) |
| 3 Vehicles | 100 (47.4%) | 73 (51.0%) |
| 4 Vehicles | 19 (9.0%) | 10 (7.0%) |
| 5 or more Vehicles | 0 (0.0%) | 0 (0.0%) |
| Total | 211 (100.0%) | 143 (100.0%) |
Commute Time in Foreman
The most frequently occuring commute durations in Foreman are 30 to 34 minutes (90 commuters, 25.6%), 15 to 19 minutes (72 commuters, 20.5%), and less than 5 minutes (53 commuters, 15.1%).
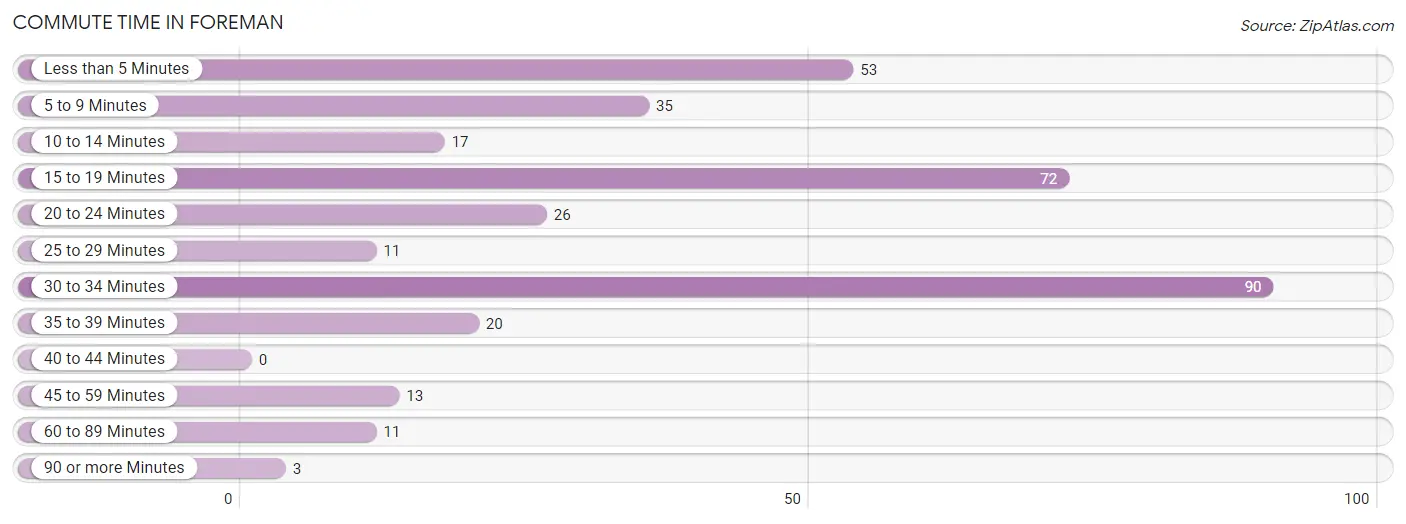
| Commute Time | # Commuters | % Commuters |
| Less than 5 Minutes | 53 | 15.1% |
| 5 to 9 Minutes | 35 | 10.0% |
| 10 to 14 Minutes | 17 | 4.8% |
| 15 to 19 Minutes | 72 | 20.5% |
| 20 to 24 Minutes | 26 | 7.4% |
| 25 to 29 Minutes | 11 | 3.1% |
| 30 to 34 Minutes | 90 | 25.6% |
| 35 to 39 Minutes | 20 | 5.7% |
| 40 to 44 Minutes | 0 | 0.0% |
| 45 to 59 Minutes | 13 | 3.7% |
| 60 to 89 Minutes | 11 | 3.1% |
| 90 or more Minutes | 3 | 0.9% |
Commute Time by Sex in Foreman
The most common commute times in Foreman are 15 to 19 minutes (55 commuters, 26.4%) for males and 30 to 34 minutes (54 commuters, 37.8%) for females.
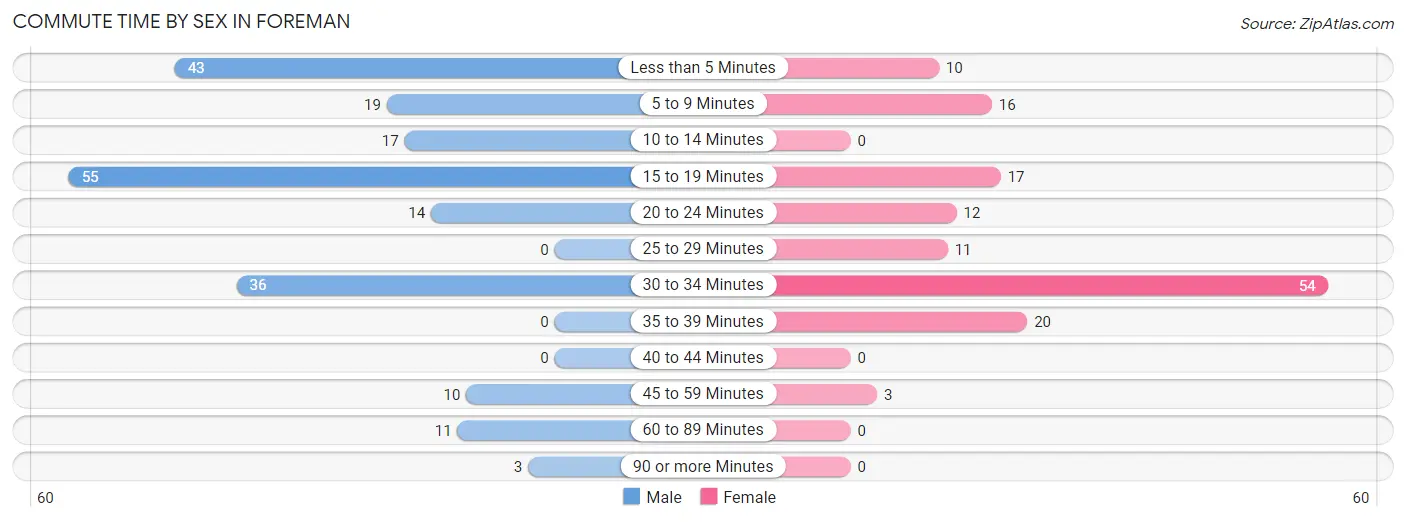
| Commute Time | Male | Female |
| Less than 5 Minutes | 43 (20.7%) | 10 (7.0%) |
| 5 to 9 Minutes | 19 (9.1%) | 16 (11.2%) |
| 10 to 14 Minutes | 17 (8.2%) | 0 (0.0%) |
| 15 to 19 Minutes | 55 (26.4%) | 17 (11.9%) |
| 20 to 24 Minutes | 14 (6.7%) | 12 (8.4%) |
| 25 to 29 Minutes | 0 (0.0%) | 11 (7.7%) |
| 30 to 34 Minutes | 36 (17.3%) | 54 (37.8%) |
| 35 to 39 Minutes | 0 (0.0%) | 20 (14.0%) |
| 40 to 44 Minutes | 0 (0.0%) | 0 (0.0%) |
| 45 to 59 Minutes | 10 (4.8%) | 3 (2.1%) |
| 60 to 89 Minutes | 11 (5.3%) | 0 (0.0%) |
| 90 or more Minutes | 3 (1.4%) | 0 (0.0%) |
Time of Departure to Work by Sex in Foreman
The most frequent times of departure to work in Foreman are 6:30 AM to 6:59 AM (81, 38.9%) for males and 6:30 AM to 6:59 AM (31, 21.7%) for females.
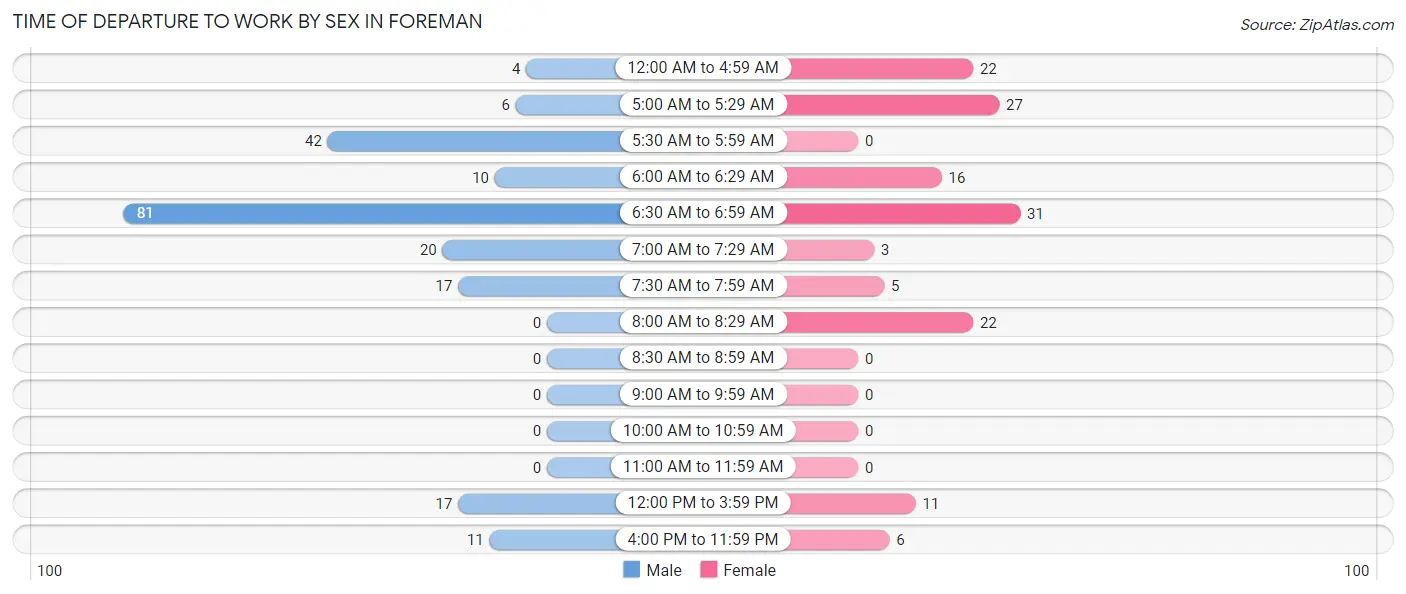
| Time of Departure | Male | Female |
| 12:00 AM to 4:59 AM | 4 (1.9%) | 22 (15.4%) |
| 5:00 AM to 5:29 AM | 6 (2.9%) | 27 (18.9%) |
| 5:30 AM to 5:59 AM | 42 (20.2%) | 0 (0.0%) |
| 6:00 AM to 6:29 AM | 10 (4.8%) | 16 (11.2%) |
| 6:30 AM to 6:59 AM | 81 (38.9%) | 31 (21.7%) |
| 7:00 AM to 7:29 AM | 20 (9.6%) | 3 (2.1%) |
| 7:30 AM to 7:59 AM | 17 (8.2%) | 5 (3.5%) |
| 8:00 AM to 8:29 AM | 0 (0.0%) | 22 (15.4%) |
| 8:30 AM to 8:59 AM | 0 (0.0%) | 0 (0.0%) |
| 9:00 AM to 9:59 AM | 0 (0.0%) | 0 (0.0%) |
| 10:00 AM to 10:59 AM | 0 (0.0%) | 0 (0.0%) |
| 11:00 AM to 11:59 AM | 0 (0.0%) | 0 (0.0%) |
| 12:00 PM to 3:59 PM | 17 (8.2%) | 11 (7.7%) |
| 4:00 PM to 11:59 PM | 11 (5.3%) | 6 (4.2%) |
| Total | 208 (100.0%) | 143 (100.0%) |
Housing Occupancy in Foreman
Occupancy by Ownership in Foreman
Of the total 447 dwellings in Foreman, owner-occupied units account for 306 (68.5%), while renter-occupied units make up 141 (31.5%).
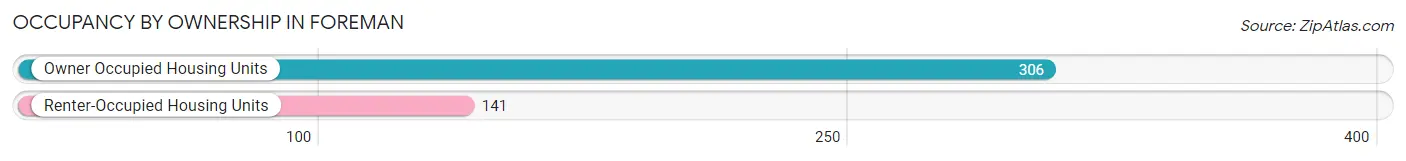
| Occupancy | # Housing Units | % Housing Units |
| Owner Occupied Housing Units | 306 | 68.5% |
| Renter-Occupied Housing Units | 141 | 31.5% |
| Total Occupied Housing Units | 447 | 100.0% |
Occupancy by Household Size in Foreman
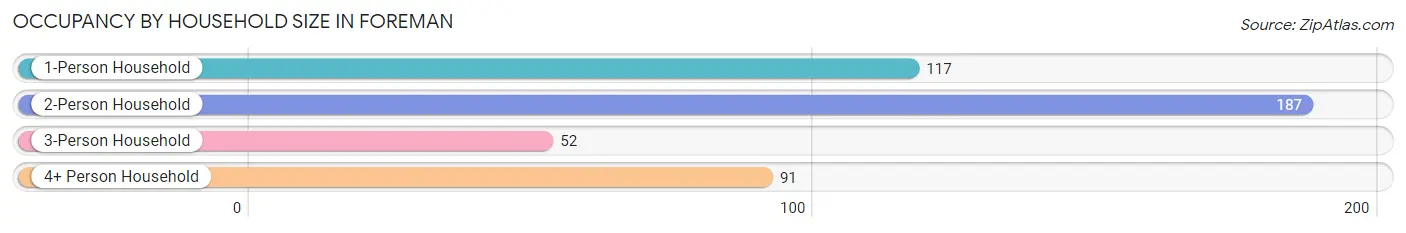
| Household Size | # Housing Units | % Housing Units |
| 1-Person Household | 117 | 26.2% |
| 2-Person Household | 187 | 41.8% |
| 3-Person Household | 52 | 11.6% |
| 4+ Person Household | 91 | 20.4% |
| Total Housing Units | 447 | 100.0% |
Occupancy by Ownership by Household Size in Foreman
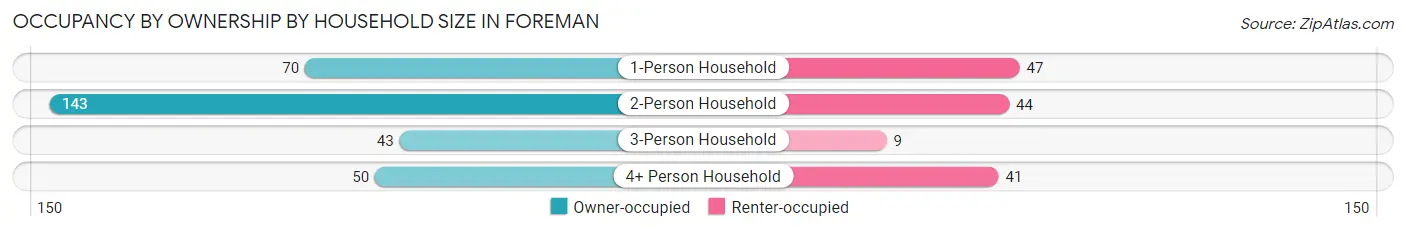
| Household Size | Owner-occupied | Renter-occupied |
| 1-Person Household | 70 (59.8%) | 47 (40.2%) |
| 2-Person Household | 143 (76.5%) | 44 (23.5%) |
| 3-Person Household | 43 (82.7%) | 9 (17.3%) |
| 4+ Person Household | 50 (54.9%) | 41 (45.1%) |
| Total Housing Units | 306 (68.5%) | 141 (31.5%) |
Occupancy by Educational Attainment in Foreman
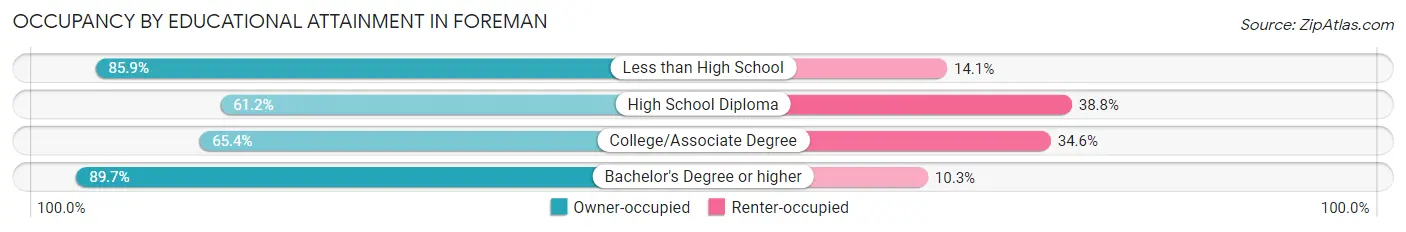
| Household Size | Owner-occupied | Renter-occupied |
| Less than High School | 55 (85.9%) | 9 (14.1%) |
| High School Diploma | 131 (61.2%) | 83 (38.8%) |
| College/Associate Degree | 85 (65.4%) | 45 (34.6%) |
| Bachelor's Degree or higher | 35 (89.7%) | 4 (10.3%) |
Occupancy by Age of Householder in Foreman
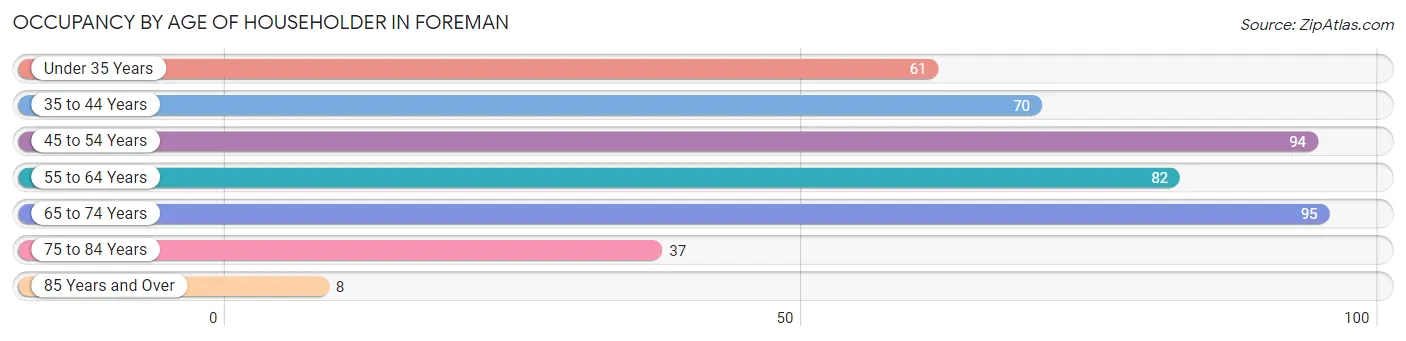
| Age Bracket | # Households | % Households |
| Under 35 Years | 61 | 13.7% |
| 35 to 44 Years | 70 | 15.7% |
| 45 to 54 Years | 94 | 21.0% |
| 55 to 64 Years | 82 | 18.3% |
| 65 to 74 Years | 95 | 21.2% |
| 75 to 84 Years | 37 | 8.3% |
| 85 Years and Over | 8 | 1.8% |
| Total | 447 | 100.0% |
Housing Finances in Foreman
Median Income by Occupancy in Foreman
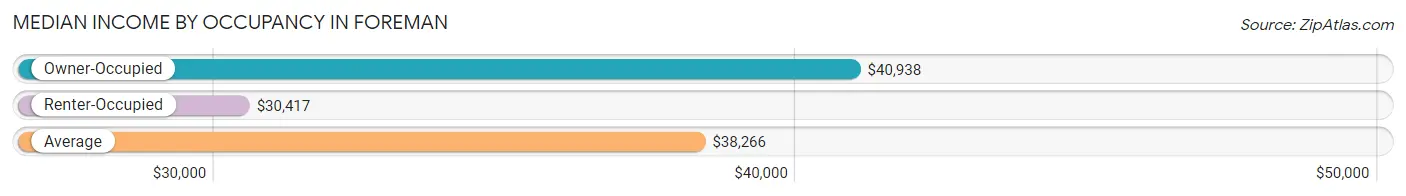
| Occupancy Type | # Households | Median Income |
| Owner-Occupied | 306 (68.5%) | $40,938 |
| Renter-Occupied | 141 (31.5%) | $30,417 |
| Average | 447 (100.0%) | $38,266 |
Occupancy by Householder Income Bracket in Foreman
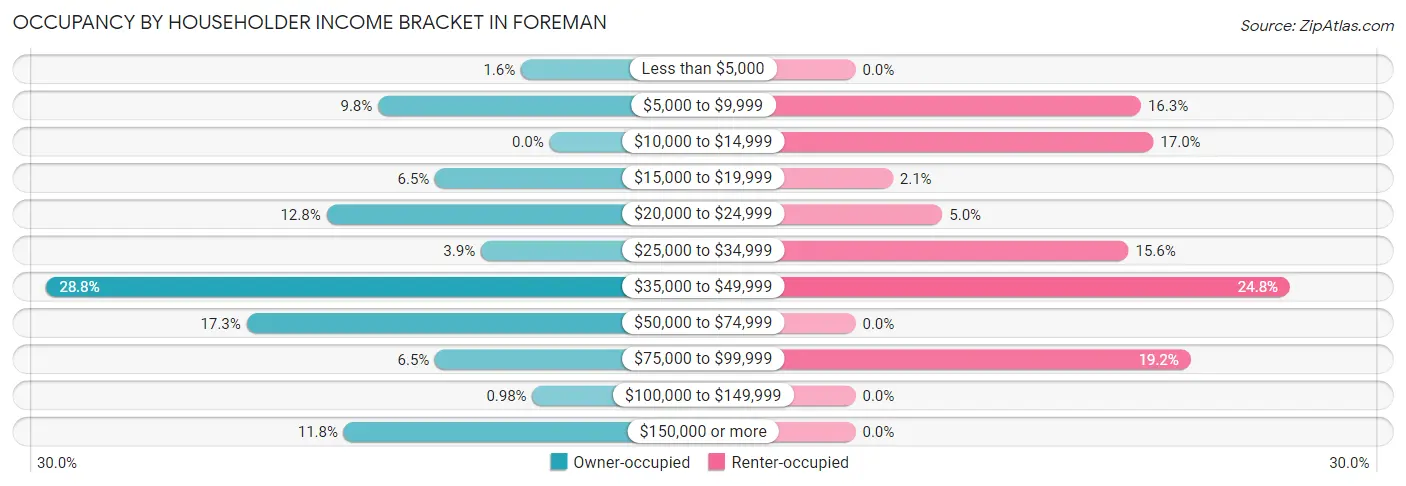
| Income Bracket | Owner-occupied | Renter-occupied |
| Less than $5,000 | 5 (1.6%) | 0 (0.0%) |
| $5,000 to $9,999 | 30 (9.8%) | 23 (16.3%) |
| $10,000 to $14,999 | 0 (0.0%) | 24 (17.0%) |
| $15,000 to $19,999 | 20 (6.5%) | 3 (2.1%) |
| $20,000 to $24,999 | 39 (12.8%) | 7 (5.0%) |
| $25,000 to $34,999 | 12 (3.9%) | 22 (15.6%) |
| $35,000 to $49,999 | 88 (28.8%) | 35 (24.8%) |
| $50,000 to $74,999 | 53 (17.3%) | 0 (0.0%) |
| $75,000 to $99,999 | 20 (6.5%) | 27 (19.2%) |
| $100,000 to $149,999 | 3 (1.0%) | 0 (0.0%) |
| $150,000 or more | 36 (11.8%) | 0 (0.0%) |
| Total | 306 (100.0%) | 141 (100.0%) |
Monthly Housing Cost Tiers in Foreman
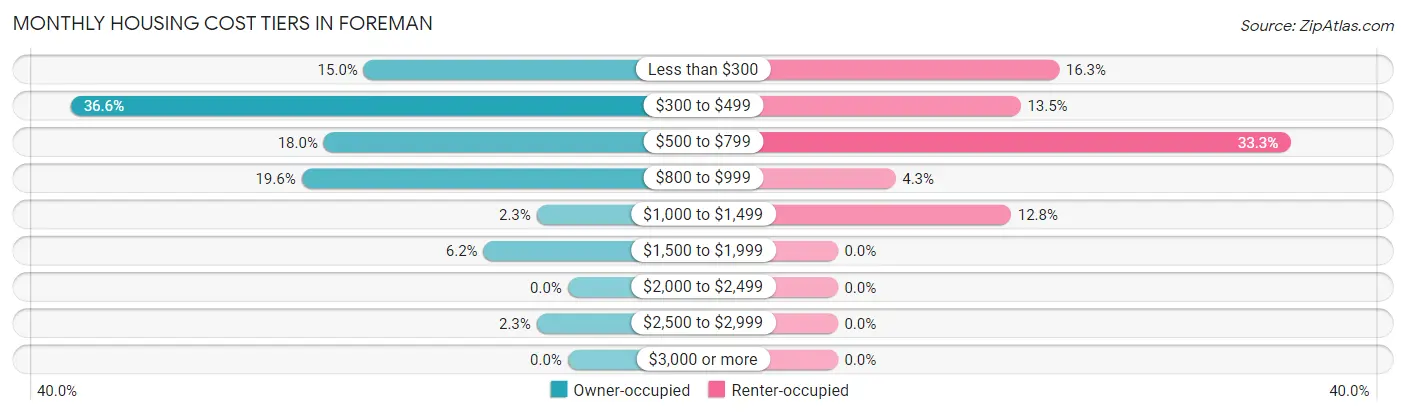
| Monthly Cost | Owner-occupied | Renter-occupied |
| Less than $300 | 46 (15.0%) | 23 (16.3%) |
| $300 to $499 | 112 (36.6%) | 19 (13.5%) |
| $500 to $799 | 55 (18.0%) | 47 (33.3%) |
| $800 to $999 | 60 (19.6%) | 6 (4.3%) |
| $1,000 to $1,499 | 7 (2.3%) | 18 (12.8%) |
| $1,500 to $1,999 | 19 (6.2%) | 0 (0.0%) |
| $2,000 to $2,499 | 0 (0.0%) | 0 (0.0%) |
| $2,500 to $2,999 | 7 (2.3%) | 0 (0.0%) |
| $3,000 or more | 0 (0.0%) | 0 (0.0%) |
| Total | 306 (100.0%) | 141 (100.0%) |
Physical Housing Characteristics in Foreman
Housing Structures in Foreman
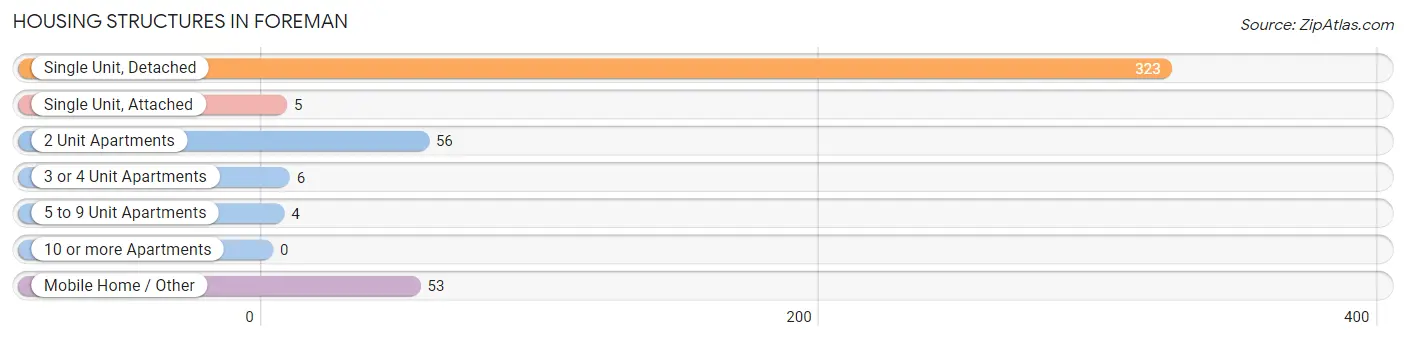
| Structure Type | # Housing Units | % Housing Units |
| Single Unit, Detached | 323 | 72.3% |
| Single Unit, Attached | 5 | 1.1% |
| 2 Unit Apartments | 56 | 12.5% |
| 3 or 4 Unit Apartments | 6 | 1.3% |
| 5 to 9 Unit Apartments | 4 | 0.9% |
| 10 or more Apartments | 0 | 0.0% |
| Mobile Home / Other | 53 | 11.9% |
| Total | 447 | 100.0% |
Housing Structures by Occupancy in Foreman
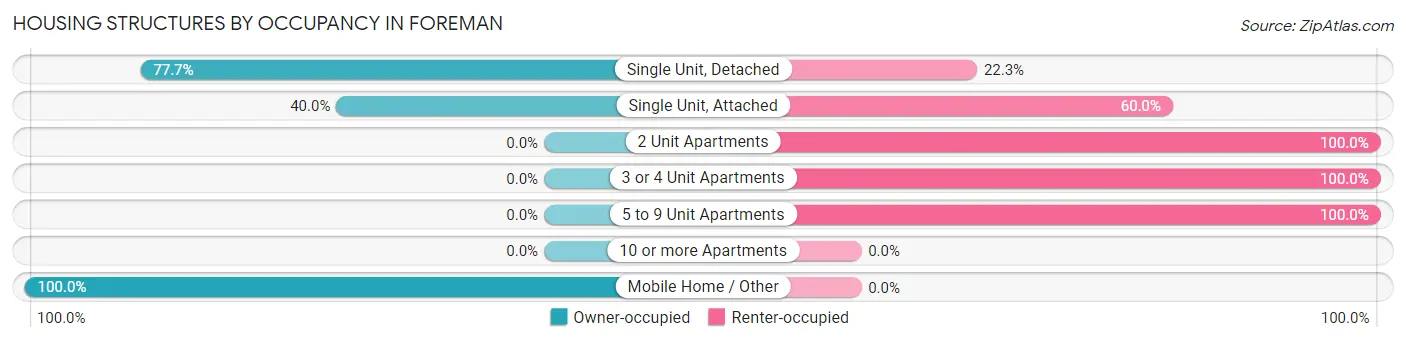
| Structure Type | Owner-occupied | Renter-occupied |
| Single Unit, Detached | 251 (77.7%) | 72 (22.3%) |
| Single Unit, Attached | 2 (40.0%) | 3 (60.0%) |
| 2 Unit Apartments | 0 (0.0%) | 56 (100.0%) |
| 3 or 4 Unit Apartments | 0 (0.0%) | 6 (100.0%) |
| 5 to 9 Unit Apartments | 0 (0.0%) | 4 (100.0%) |
| 10 or more Apartments | 0 (0.0%) | 0 (0.0%) |
| Mobile Home / Other | 53 (100.0%) | 0 (0.0%) |
| Total | 306 (68.5%) | 141 (31.5%) |
Housing Structures by Number of Rooms in Foreman
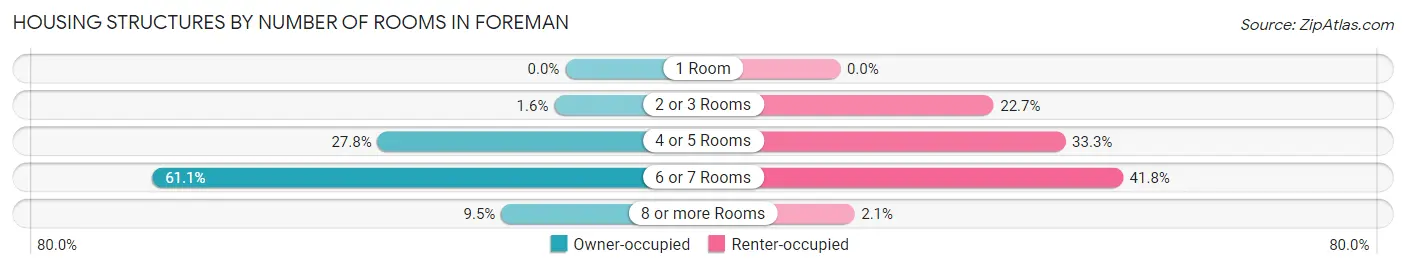
| Number of Rooms | Owner-occupied | Renter-occupied |
| 1 Room | 0 (0.0%) | 0 (0.0%) |
| 2 or 3 Rooms | 5 (1.6%) | 32 (22.7%) |
| 4 or 5 Rooms | 85 (27.8%) | 47 (33.3%) |
| 6 or 7 Rooms | 187 (61.1%) | 59 (41.8%) |
| 8 or more Rooms | 29 (9.5%) | 3 (2.1%) |
| Total | 306 (100.0%) | 141 (100.0%) |
Housing Structure by Heating Type in Foreman
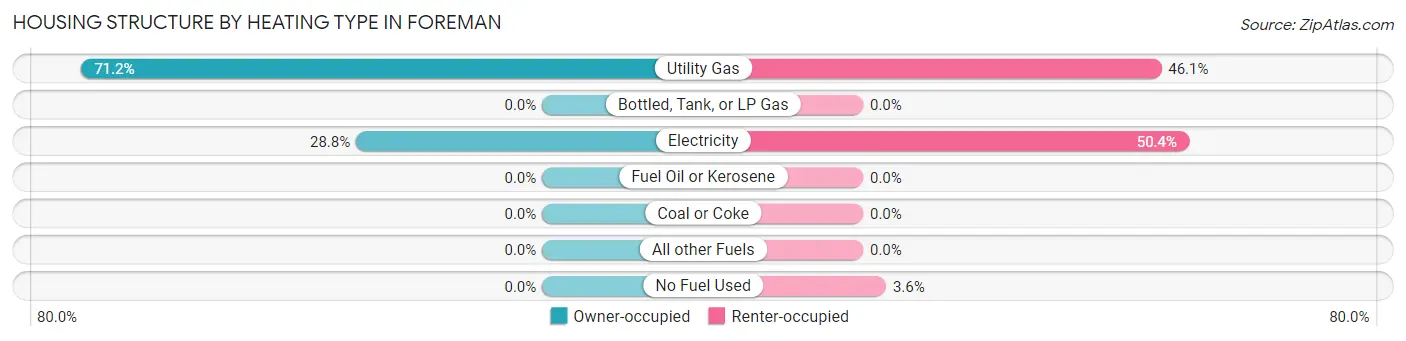
| Heating Type | Owner-occupied | Renter-occupied |
| Utility Gas | 218 (71.2%) | 65 (46.1%) |
| Bottled, Tank, or LP Gas | 0 (0.0%) | 0 (0.0%) |
| Electricity | 88 (28.8%) | 71 (50.3%) |
| Fuel Oil or Kerosene | 0 (0.0%) | 0 (0.0%) |
| Coal or Coke | 0 (0.0%) | 0 (0.0%) |
| All other Fuels | 0 (0.0%) | 0 (0.0%) |
| No Fuel Used | 0 (0.0%) | 5 (3.5%) |
| Total | 306 (100.0%) | 141 (100.0%) |
Household Vehicle Usage in Foreman
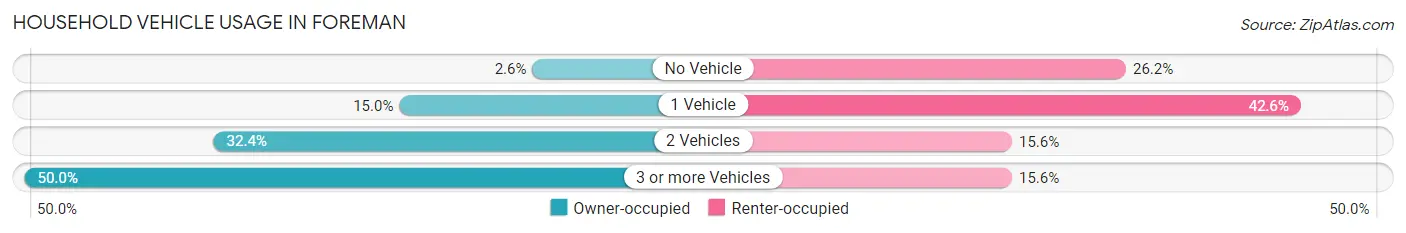
| Vehicles per Household | Owner-occupied | Renter-occupied |
| No Vehicle | 8 (2.6%) | 37 (26.2%) |
| 1 Vehicle | 46 (15.0%) | 60 (42.5%) |
| 2 Vehicles | 99 (32.4%) | 22 (15.6%) |
| 3 or more Vehicles | 153 (50.0%) | 22 (15.6%) |
| Total | 306 (100.0%) | 141 (100.0%) |
Real Estate & Mortgages in Foreman
Real Estate and Mortgage Overview in Foreman
| Characteristic | Without Mortgage | With Mortgage |
| Housing Units | 167 | 139 |
| Median Property Value | $72,700 | $87,800 |
| Median Household Income | $36,307 | $24 |
| Monthly Housing Costs | $331 | $0 |
| Real Estate Taxes | $330 | $23 |
Property Value by Mortgage Status in Foreman
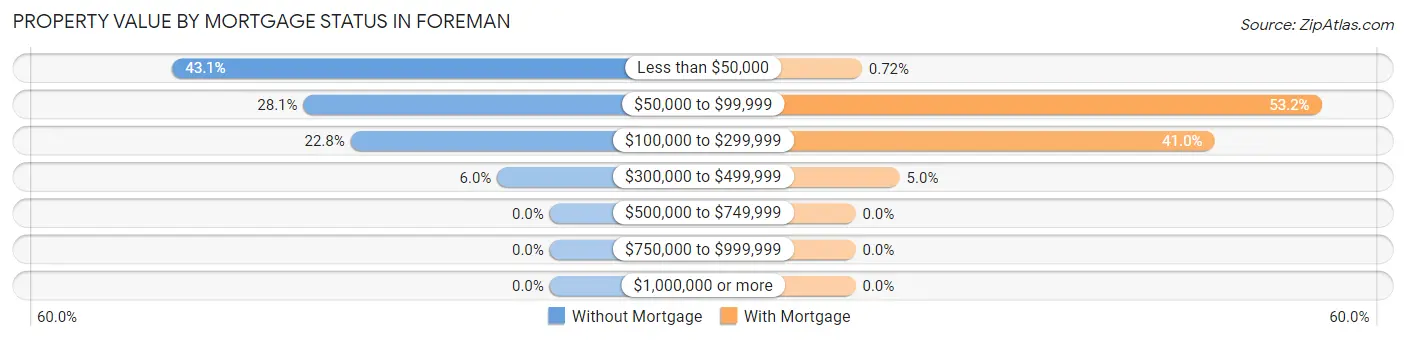
| Property Value | Without Mortgage | With Mortgage |
| Less than $50,000 | 72 (43.1%) | 1 (0.7%) |
| $50,000 to $99,999 | 47 (28.1%) | 74 (53.2%) |
| $100,000 to $299,999 | 38 (22.8%) | 57 (41.0%) |
| $300,000 to $499,999 | 10 (6.0%) | 7 (5.0%) |
| $500,000 to $749,999 | 0 (0.0%) | 0 (0.0%) |
| $750,000 to $999,999 | 0 (0.0%) | 0 (0.0%) |
| $1,000,000 or more | 0 (0.0%) | 0 (0.0%) |
| Total | 167 (100.0%) | 139 (100.0%) |
Household Income by Mortgage Status in Foreman
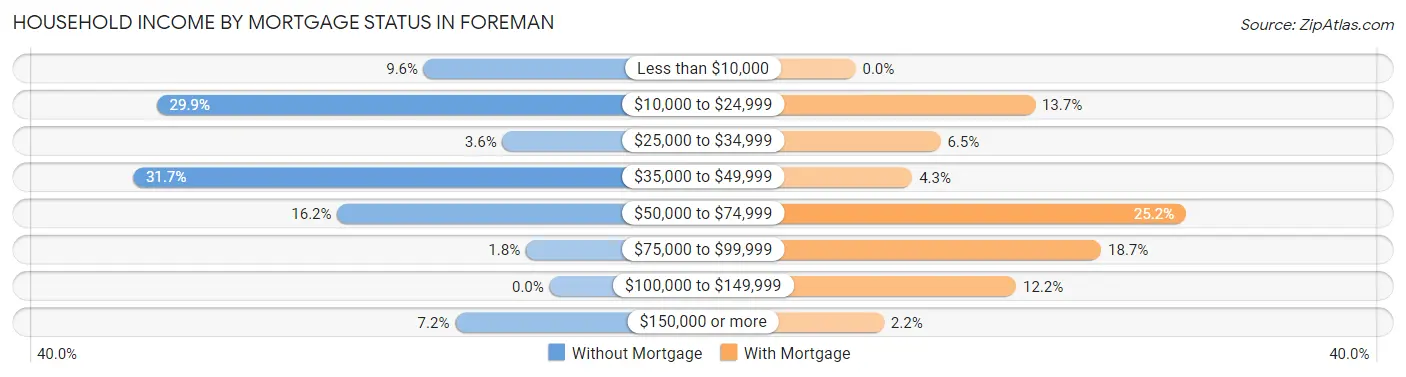
| Household Income | Without Mortgage | With Mortgage |
| Less than $10,000 | 16 (9.6%) | 0 (0.0%) |
| $10,000 to $24,999 | 50 (29.9%) | 19 (13.7%) |
| $25,000 to $34,999 | 6 (3.6%) | 9 (6.5%) |
| $35,000 to $49,999 | 53 (31.7%) | 6 (4.3%) |
| $50,000 to $74,999 | 27 (16.2%) | 35 (25.2%) |
| $75,000 to $99,999 | 3 (1.8%) | 26 (18.7%) |
| $100,000 to $149,999 | 0 (0.0%) | 17 (12.2%) |
| $150,000 or more | 12 (7.2%) | 3 (2.2%) |
| Total | 167 (100.0%) | 139 (100.0%) |
Property Value to Household Income Ratio in Foreman
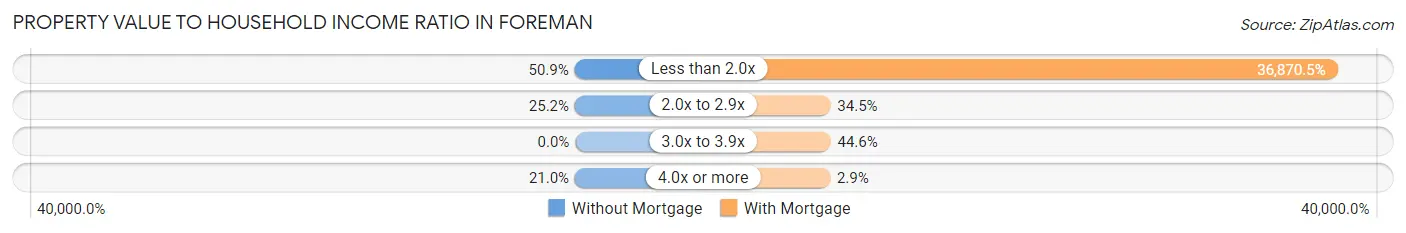
| Value-to-Income Ratio | Without Mortgage | With Mortgage |
| Less than 2.0x | 85 (50.9%) | 51,250 (36,870.5%) |
| 2.0x to 2.9x | 42 (25.2%) | 48 (34.5%) |
| 3.0x to 3.9x | 0 (0.0%) | 62 (44.6%) |
| 4.0x or more | 35 (21.0%) | 4 (2.9%) |
| Total | 167 (100.0%) | 139 (100.0%) |
Real Estate Taxes by Mortgage Status in Foreman
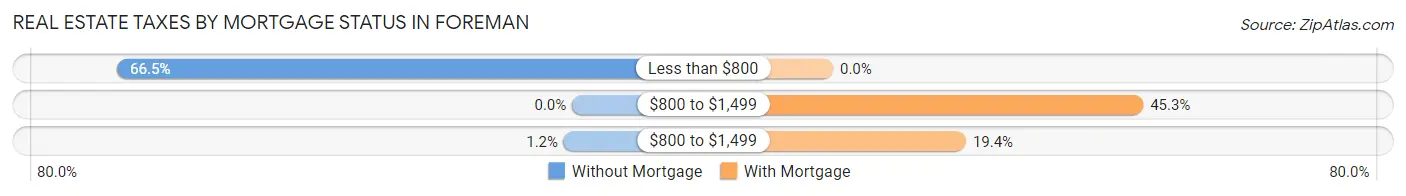
| Property Taxes | Without Mortgage | With Mortgage |
| Less than $800 | 111 (66.5%) | 0 (0.0%) |
| $800 to $1,499 | 0 (0.0%) | 63 (45.3%) |
| $800 to $1,499 | 2 (1.2%) | 27 (19.4%) |
| Total | 167 (100.0%) | 139 (100.0%) |
Health & Disability in Foreman
Health Insurance Coverage by Age in Foreman
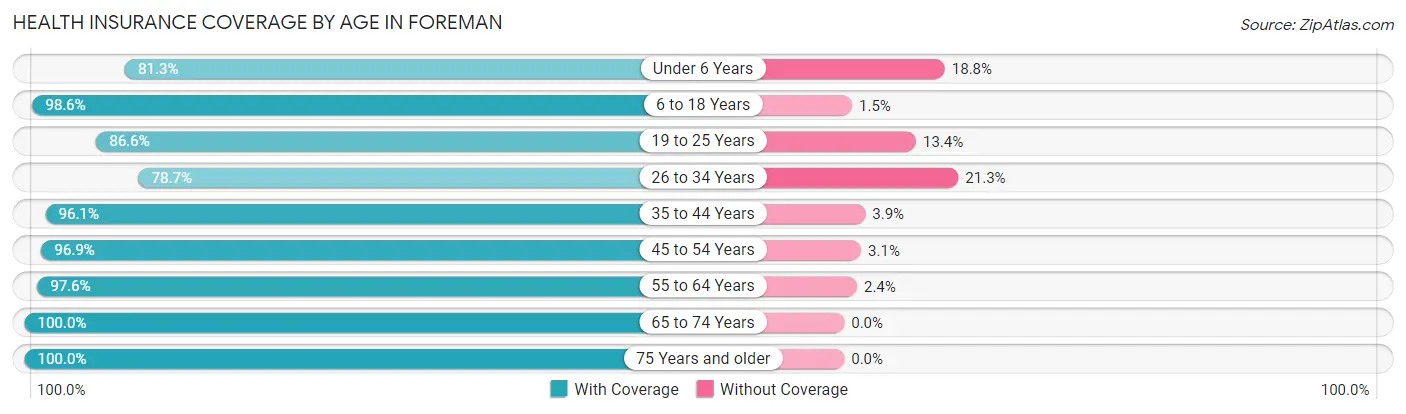
| Age Bracket | With Coverage | Without Coverage |
| Under 6 Years | 104 (81.2%) | 24 (18.8%) |
| 6 to 18 Years | 204 (98.6%) | 3 (1.5%) |
| 19 to 25 Years | 123 (86.6%) | 19 (13.4%) |
| 26 to 34 Years | 74 (78.7%) | 20 (21.3%) |
| 35 to 44 Years | 147 (96.1%) | 6 (3.9%) |
| 45 to 54 Years | 154 (96.9%) | 5 (3.1%) |
| 55 to 64 Years | 123 (97.6%) | 3 (2.4%) |
| 65 to 74 Years | 123 (100.0%) | 0 (0.0%) |
| 75 Years and older | 82 (100.0%) | 0 (0.0%) |
| Total | 1,134 (93.4%) | 80 (6.6%) |
Health Insurance Coverage by Citizenship Status in Foreman
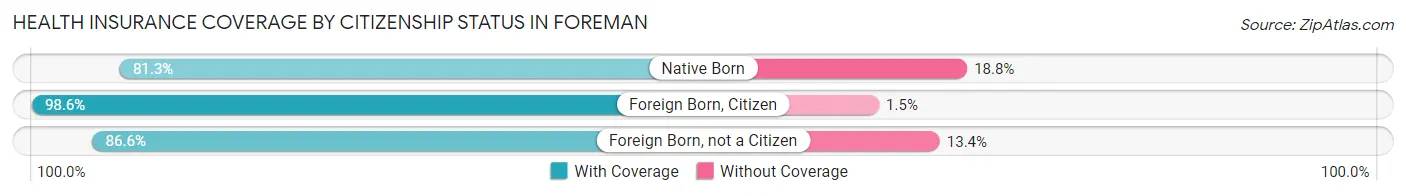
| Citizenship Status | With Coverage | Without Coverage |
| Native Born | 104 (81.2%) | 24 (18.8%) |
| Foreign Born, Citizen | 204 (98.6%) | 3 (1.5%) |
| Foreign Born, not a Citizen | 123 (86.6%) | 19 (13.4%) |
Health Insurance Coverage by Household Income in Foreman
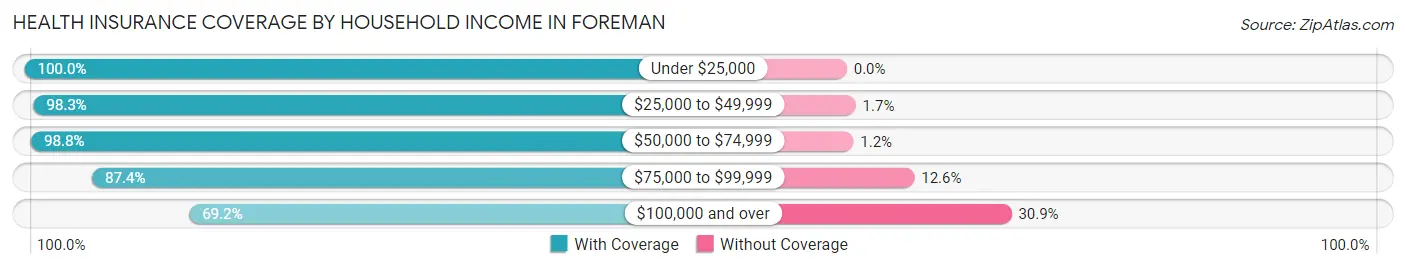
| Household Income | With Coverage | Without Coverage |
| Under $25,000 | 233 (100.0%) | 0 (0.0%) |
| $25,000 to $49,999 | 534 (98.3%) | 9 (1.7%) |
| $50,000 to $74,999 | 161 (98.8%) | 2 (1.2%) |
| $75,000 to $99,999 | 76 (87.4%) | 11 (12.6%) |
| $100,000 and over | 130 (69.2%) | 58 (30.8%) |
Public vs Private Health Insurance Coverage by Age in Foreman
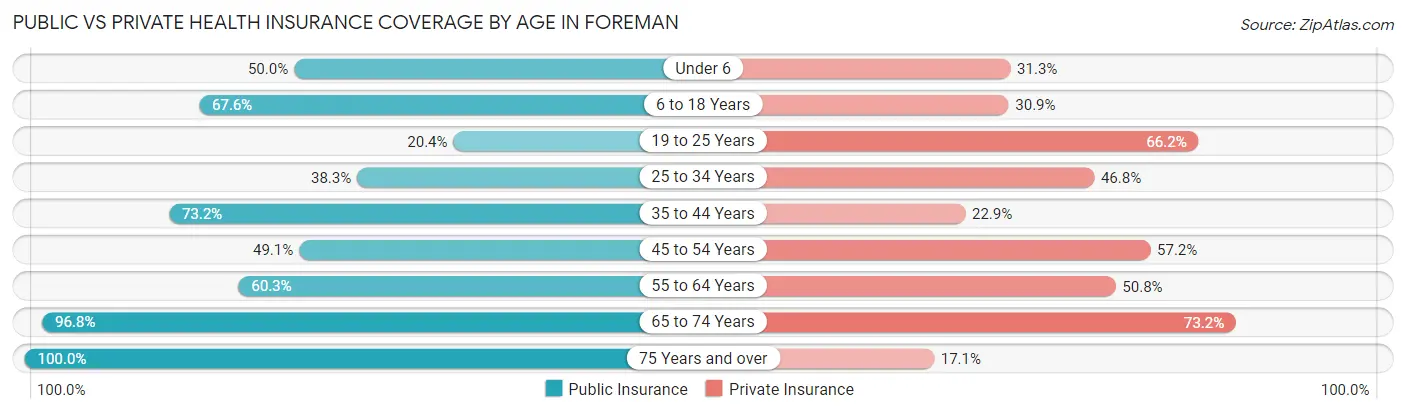
| Age Bracket | Public Insurance | Private Insurance |
| Under 6 | 64 (50.0%) | 40 (31.2%) |
| 6 to 18 Years | 140 (67.6%) | 64 (30.9%) |
| 19 to 25 Years | 29 (20.4%) | 94 (66.2%) |
| 25 to 34 Years | 36 (38.3%) | 44 (46.8%) |
| 35 to 44 Years | 112 (73.2%) | 35 (22.9%) |
| 45 to 54 Years | 78 (49.1%) | 91 (57.2%) |
| 55 to 64 Years | 76 (60.3%) | 64 (50.8%) |
| 65 to 74 Years | 119 (96.8%) | 90 (73.2%) |
| 75 Years and over | 82 (100.0%) | 14 (17.1%) |
| Total | 736 (60.6%) | 536 (44.2%) |
Disability Status by Sex by Age in Foreman
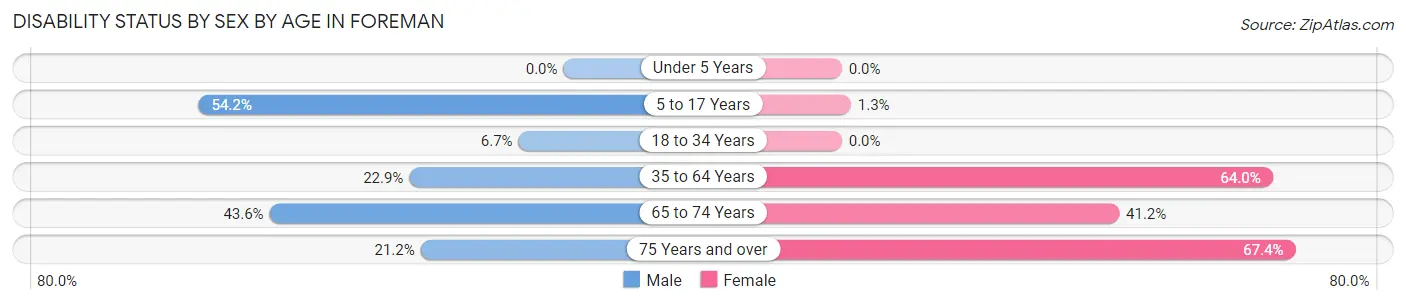
| Age Bracket | Male | Female |
| Under 5 Years | 0 (0.0%) | 0 (0.0%) |
| 5 to 17 Years | 39 (54.2%) | 2 (1.3%) |
| 18 to 34 Years | 9 (6.7%) | 0 (0.0%) |
| 35 to 64 Years | 38 (22.9%) | 174 (64.0%) |
| 65 to 74 Years | 24 (43.6%) | 28 (41.2%) |
| 75 Years and over | 7 (21.2%) | 33 (67.3%) |
Disability Class by Sex by Age in Foreman
Disability Class: Hearing Difficulty
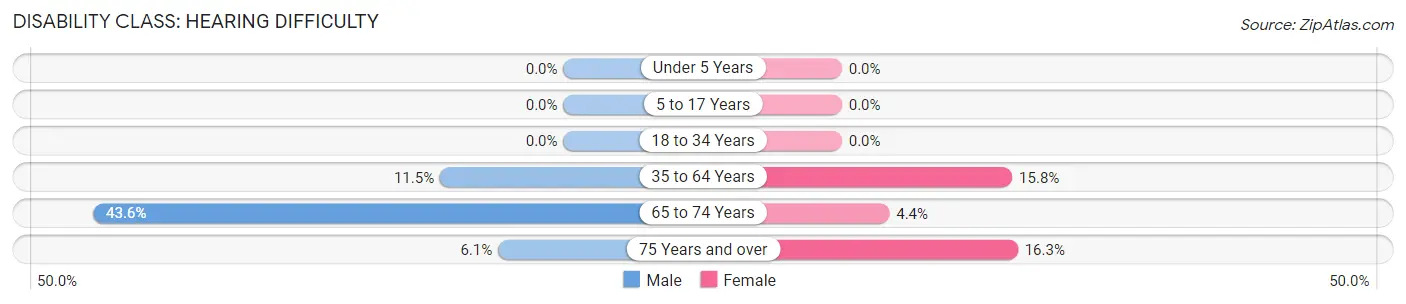
| Age Bracket | Male | Female |
| Under 5 Years | 0 (0.0%) | 0 (0.0%) |
| 5 to 17 Years | 0 (0.0%) | 0 (0.0%) |
| 18 to 34 Years | 0 (0.0%) | 0 (0.0%) |
| 35 to 64 Years | 19 (11.5%) | 43 (15.8%) |
| 65 to 74 Years | 24 (43.6%) | 3 (4.4%) |
| 75 Years and over | 2 (6.1%) | 8 (16.3%) |
Disability Class: Vision Difficulty
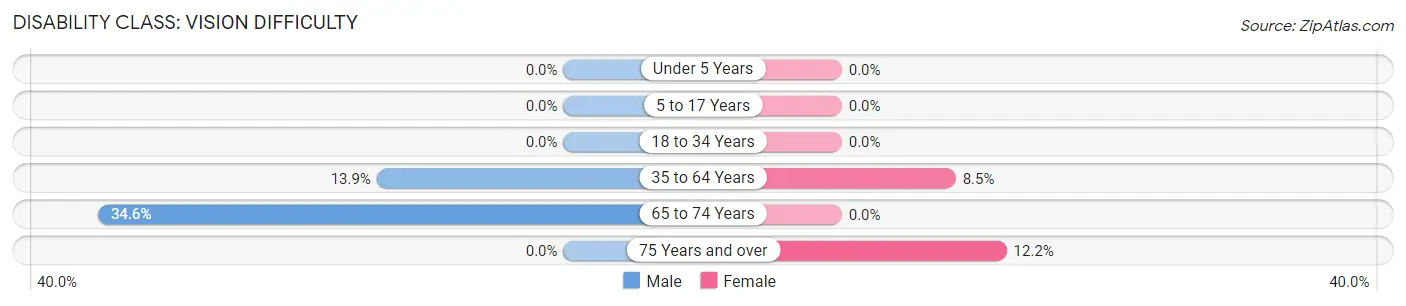
| Age Bracket | Male | Female |
| Under 5 Years | 0 (0.0%) | 0 (0.0%) |
| 5 to 17 Years | 0 (0.0%) | 0 (0.0%) |
| 18 to 34 Years | 0 (0.0%) | 0 (0.0%) |
| 35 to 64 Years | 23 (13.9%) | 23 (8.5%) |
| 65 to 74 Years | 19 (34.5%) | 0 (0.0%) |
| 75 Years and over | 0 (0.0%) | 6 (12.2%) |
Disability Class: Cognitive Difficulty
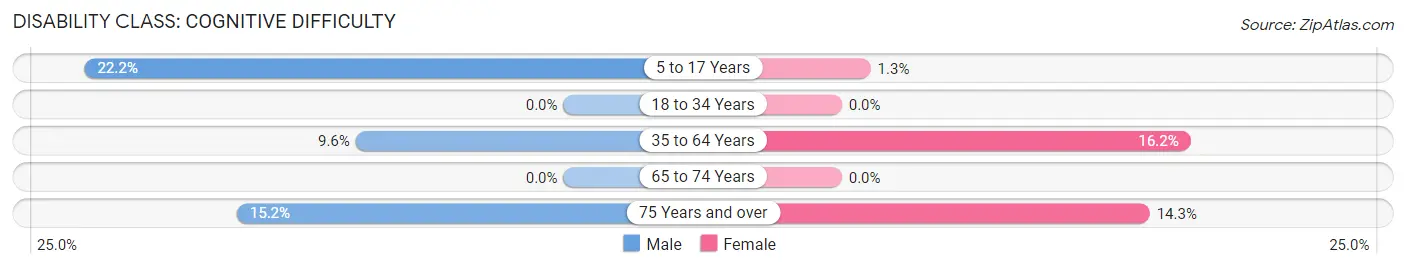
| Age Bracket | Male | Female |
| 5 to 17 Years | 16 (22.2%) | 2 (1.3%) |
| 18 to 34 Years | 0 (0.0%) | 0 (0.0%) |
| 35 to 64 Years | 16 (9.6%) | 44 (16.2%) |
| 65 to 74 Years | 0 (0.0%) | 0 (0.0%) |
| 75 Years and over | 5 (15.1%) | 7 (14.3%) |
Disability Class: Ambulatory Difficulty
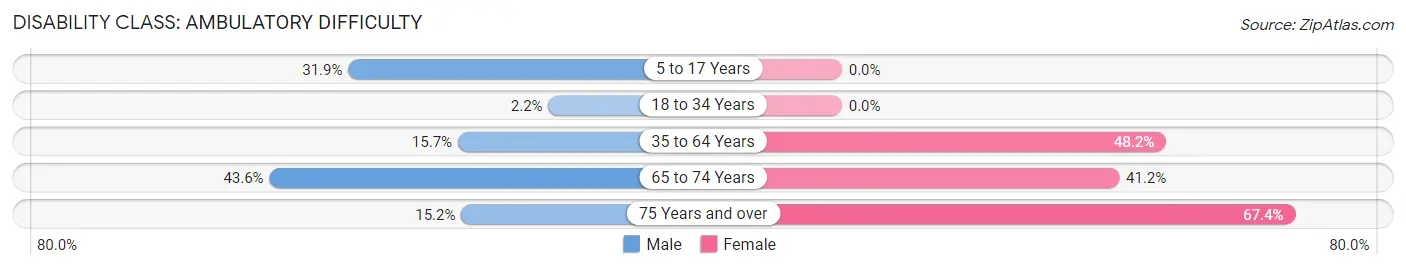
| Age Bracket | Male | Female |
| 5 to 17 Years | 23 (31.9%) | 0 (0.0%) |
| 18 to 34 Years | 3 (2.2%) | 0 (0.0%) |
| 35 to 64 Years | 26 (15.7%) | 131 (48.2%) |
| 65 to 74 Years | 24 (43.6%) | 28 (41.2%) |
| 75 Years and over | 5 (15.1%) | 33 (67.3%) |
Disability Class: Self-Care Difficulty
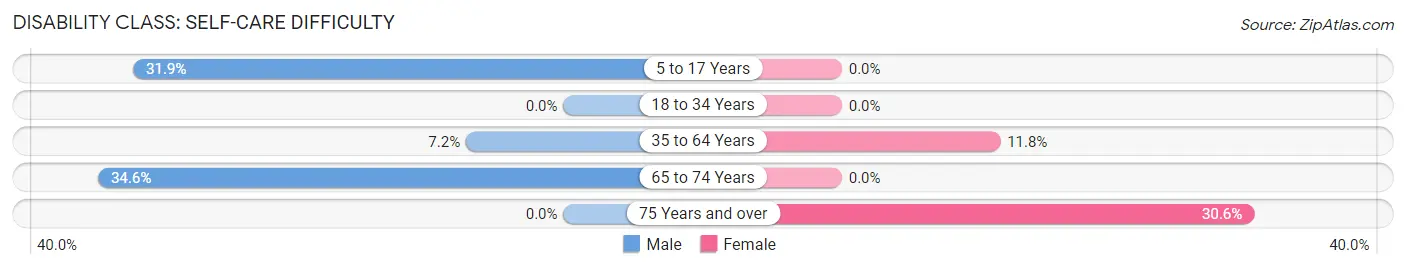
| Age Bracket | Male | Female |
| 5 to 17 Years | 23 (31.9%) | 0 (0.0%) |
| 18 to 34 Years | 0 (0.0%) | 0 (0.0%) |
| 35 to 64 Years | 12 (7.2%) | 32 (11.8%) |
| 65 to 74 Years | 19 (34.5%) | 0 (0.0%) |
| 75 Years and over | 0 (0.0%) | 15 (30.6%) |
Technology Access in Foreman
Computing Device Access in Foreman
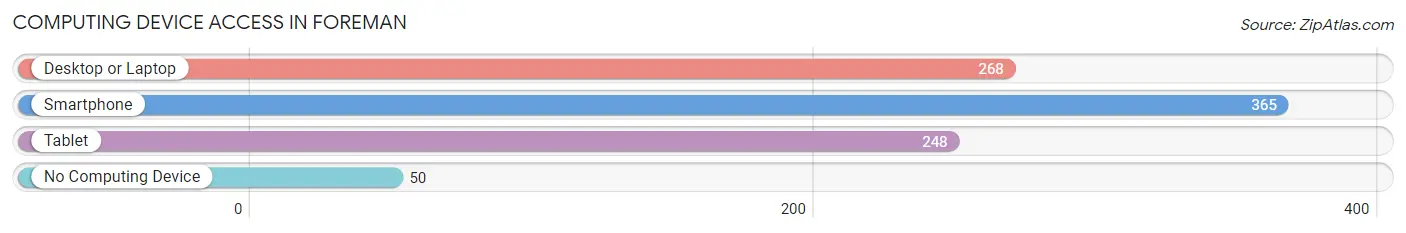
| Device Type | # Households | % Households |
| Desktop or Laptop | 268 | 60.0% |
| Smartphone | 365 | 81.7% |
| Tablet | 248 | 55.5% |
| No Computing Device | 50 | 11.2% |
| Total | 447 | 100.0% |
Internet Access in Foreman
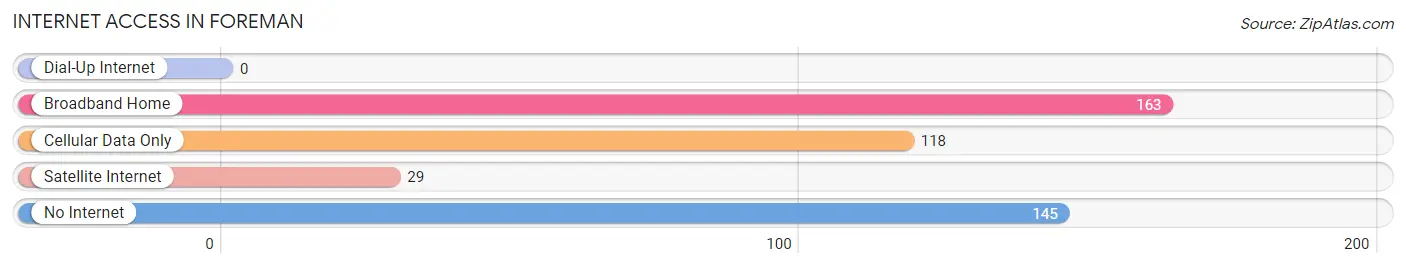
| Internet Type | # Households | % Households |
| Dial-Up Internet | 0 | 0.0% |
| Broadband Home | 163 | 36.5% |
| Cellular Data Only | 118 | 26.4% |
| Satellite Internet | 29 | 6.5% |
| No Internet | 145 | 32.4% |
| Total | 447 | 100.0% |
Foreman Summary
Foreman, Arkansas is a small city located in Little River County in the southwestern corner of the state. It is situated on the banks of the Little River, which is a tributary of the Red River. The city is located about 30 miles south of Texarkana and about 40 miles north of the Louisiana border. The population of Foreman was 1,845 at the 2010 census, making it the second-largest city in Little River County.
History
Foreman was founded in 1887 by the Little River Lumber Company. The company was owned by the Foreman family, who had moved to the area from Tennessee. The town was named after the family and was incorporated in 1891.
The town grew rapidly in the early 1900s, and by 1910, it had a population of 1,000. The town was a major center for the lumber industry, and the Foreman family owned several sawmills in the area. The town also had a cotton gin, a grist mill, and a brick factory.
In the 1920s, the town began to decline as the lumber industry moved away. The Great Depression further hurt the town, and by 1940, the population had dropped to just over 500.
The town began to recover in the 1950s, and by 1960, the population had grown to 1,200. The town has continued to grow since then, and today, it is a thriving community with a population of over 1,800.
Geography
Foreman is located in the southwestern corner of Arkansas, about 30 miles south of Texarkana and 40 miles north of the Louisiana border. The city is situated on the banks of the Little River, which is a tributary of the Red River.
The city has a total area of 2.2 square miles, all of which is land. The terrain is mostly flat, with some rolling hills in the area. The climate is humid subtropical, with hot summers and mild winters.
Economy
Foreman’s economy is largely based on agriculture and forestry. The town is home to several farms, and the surrounding area is known for its timber production. The town also has a few small businesses, including a grocery store, a hardware store, and a few restaurants.
Demographics
As of the 2010 census, the population of Foreman was 1,845. The racial makeup of the town was 79.2% White, 17.3% African American, 0.7% Native American, 0.3% Asian, 0.1% Pacific Islander, and 2.4% from other races. Hispanic or Latino of any race were 2.7% of the population.
The median household income in Foreman was $30,938, and the median family income was $37,917. The per capita income was $15,945. About 18.2% of the population was below the poverty line.
Conclusion
Foreman, Arkansas is a small city located in Little River County in the southwestern corner of the state. It is situated on the banks of the Little River, and the population of Foreman was 1,845 at the 2010 census. The town was founded in 1887 by the Little River Lumber Company and was named after the Foreman family. The town’s economy is largely based on agriculture and forestry, and the racial makeup of the town is 79.2% White, 17.3% African American, 0.7% Native American, 0.3% Asian, 0.1% Pacific Islander, and 2.4% from other races. The median household income in Foreman was $30,938, and the median family income was $37,917.
Common Questions
What is Per Capita Income in Foreman?
Per Capita income in Foreman is $20,837.
What is the Median Family Income in Foreman?
Median Family Income in Foreman is $39,850.
What is the Median Household income in Foreman?
Median Household Income in Foreman is $38,266.
What is Income or Wage Gap in Foreman?
Income or Wage Gap in Foreman is 50.2%.
Women in Foreman earn 49.8 cents for every dollar earned by a man.
What is Family Income Deficit in Foreman?
Family Income Deficit in Foreman is $9,136.
Families that are below poverty line in Foreman earn $9,136 less on average than the poverty threshold level.
What is Inequality or Gini Index in Foreman?
Inequality or Gini Index in Foreman is 0.44.
What is the Total Population of Foreman?
Total Population of Foreman is 1,214.
What is the Total Male Population of Foreman?
Total Male Population of Foreman is 553.
What is the Total Female Population of Foreman?
Total Female Population of Foreman is 661.
What is the Ratio of Males per 100 Females in Foreman?
There are 83.66 Males per 100 Females in Foreman.
What is the Ratio of Females per 100 Males in Foreman?
There are 119.53 Females per 100 Males in Foreman.
What is the Median Population Age in Foreman?
Median Population Age in Foreman is 39.1 Years.
What is the Average Family Size in Foreman
Average Family Size in Foreman is 3.1 People.
What is the Average Household Size in Foreman
Average Household Size in Foreman is 2.7 People.
How Large is the Labor Force in Foreman?
There are 398 People in the Labor Forcein in Foreman.
What is the Percentage of People in the Labor Force in Foreman?
43.2% of People are in the Labor Force in Foreman.
What is the Unemployment Rate in Foreman?
Unemployment Rate in Foreman is 10.8%.