Zip Codes with the Highest Percentage of Population Employed in Food Preparation & Serving in Birmingham, AL
RELATED REPORTS & OPTIONS
Food Preparation & Serving
Birmingham
Compare Zip Codes
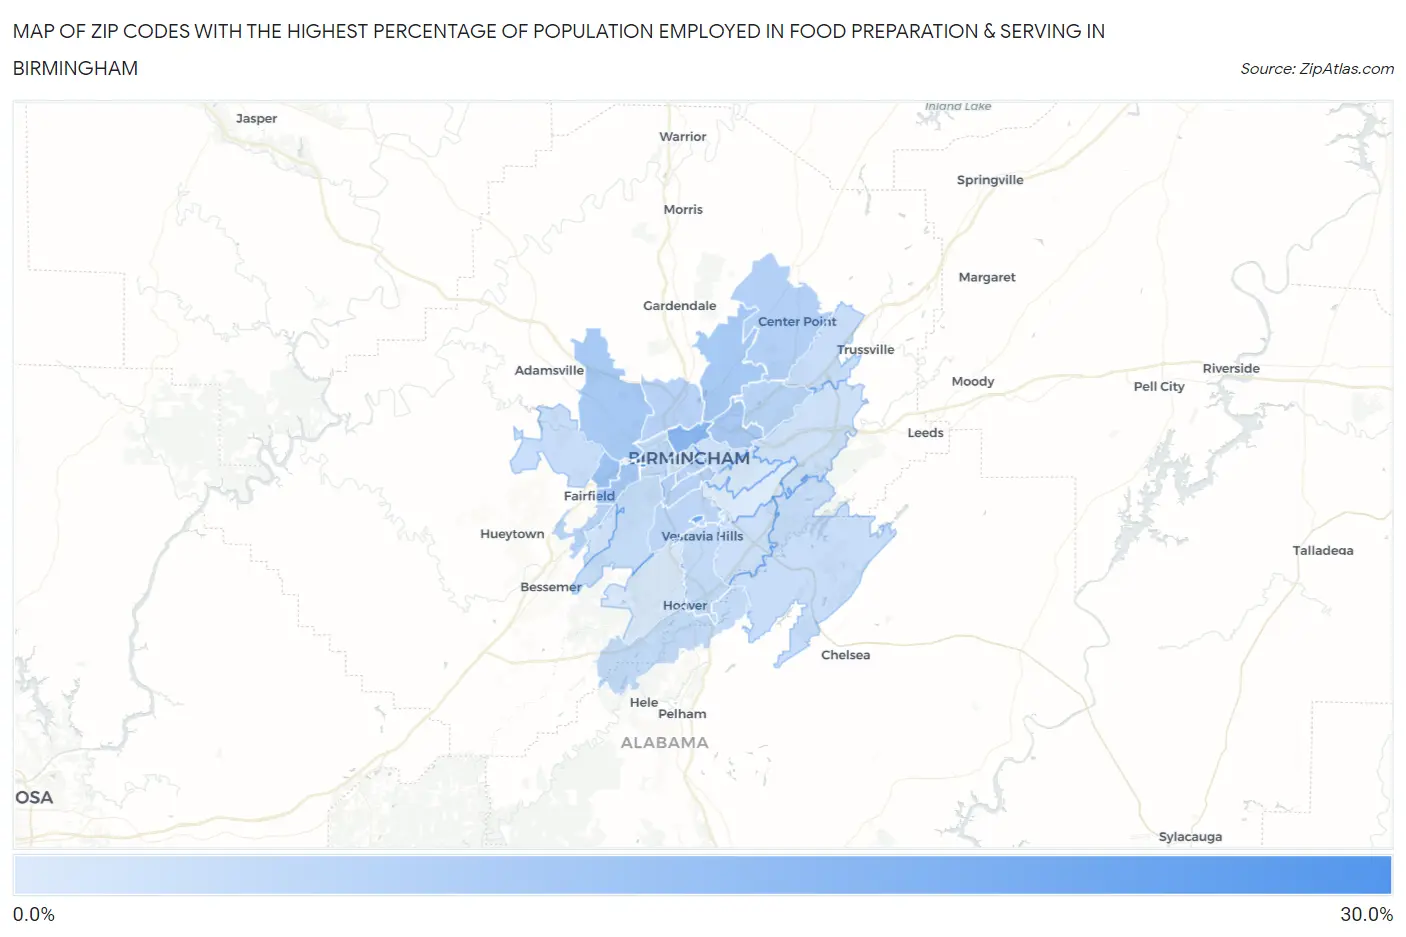
Map of Zip Codes with the Highest Percentage of Population Employed in Food Preparation & Serving in Birmingham
1.1%
25.3%
Zip Codes with the Highest Percentage of Population Employed in Food Preparation & Serving in Birmingham, AL
| Zip Code | % Employed | vs State | vs National | |
| 1. | 35254 | 25.3% | 5.2%(+20.1)#4 | 5.3%(+20.0)#306 |
| 2. | 35229 | 17.9% | 5.2%(+12.7)#14 | 5.3%(+12.6)#666 |
| 3. | 35234 | 13.8% | 5.2%(+8.63)#22 | 5.3%(+8.55)#1,197 |
| 4. | 35218 | 10.4% | 5.2%(+5.20)#42 | 5.3%(+5.12)#2,373 |
| 5. | 35208 | 9.4% | 5.2%(+4.18)#60 | 5.3%(+4.10)#3,152 |
| 6. | 35214 | 9.2% | 5.2%(+4.05)#63 | 5.3%(+3.96)#3,281 |
| 7. | 35217 | 9.2% | 5.2%(+3.99)#64 | 5.3%(+3.90)#3,336 |
| 8. | 35212 | 8.7% | 5.2%(+3.51)#78 | 5.3%(+3.42)#3,839 |
| 9. | 35215 | 7.3% | 5.2%(+2.10)#121 | 5.3%(+2.01)#5,928 |
| 10. | 35205 | 6.6% | 5.2%(+1.41)#152 | 5.3%(+1.32)#7,587 |
| 11. | 35207 | 6.5% | 5.2%(+1.30)#156 | 5.3%(+1.21)#7,880 |
| 12. | 35233 | 6.5% | 5.2%(+1.28)#159 | 5.3%(+1.20)#7,924 |
| 13. | 35206 | 6.4% | 5.2%(+1.19)#162 | 5.3%(+1.10)#8,170 |
| 14. | 35228 | 6.2% | 5.2%(+1.03)#168 | 5.3%(+0.944)#8,649 |
| 15. | 35209 | 5.8% | 5.2%(+0.577)#194 | 5.3%(+0.491)#10,099 |
| 16. | 35244 | 4.9% | 5.2%(-0.255)#253 | 5.3%(-0.341)#13,165 |
| 17. | 35216 | 4.9% | 5.2%(-0.340)#263 | 5.3%(-0.425)#13,515 |
| 18. | 35204 | 4.7% | 5.2%(-0.491)#270 | 5.3%(-0.577)#14,124 |
| 19. | 35211 | 4.4% | 5.2%(-0.839)#295 | 5.3%(-0.925)#15,598 |
| 20. | 35224 | 4.3% | 5.2%(-0.888)#300 | 5.3%(-0.974)#15,834 |
| 21. | 35235 | 4.2% | 5.2%(-0.955)#302 | 5.3%(-1.04)#16,125 |
| 22. | 35242 | 4.2% | 5.2%(-1.01)#306 | 5.3%(-1.10)#16,364 |
| 23. | 35243 | 3.5% | 5.2%(-1.74)#356 | 5.3%(-1.83)#19,354 |
| 24. | 35222 | 3.2% | 5.2%(-1.95)#369 | 5.3%(-2.04)#20,297 |
| 25. | 35210 | 3.2% | 5.2%(-1.97)#371 | 5.3%(-2.05)#20,369 |
| 26. | 35221 | 2.9% | 5.2%(-2.31)#400 | 5.3%(-2.40)#21,710 |
| 27. | 35203 | 2.5% | 5.2%(-2.68)#419 | 5.3%(-2.76)#23,073 |
| 28. | 35213 | 2.1% | 5.2%(-3.08)#444 | 5.3%(-3.17)#24,348 |
| 29. | 35226 | 1.9% | 5.2%(-3.30)#460 | 5.3%(-3.38)#24,993 |
| 30. | 35223 | 1.1% | 5.2%(-4.06)#505 | 5.3%(-4.15)#26,728 |
1
Common Questions
What are the Top 10 Zip Codes with the Highest Percentage of Population Employed in Food Preparation & Serving in Birmingham, AL?
Top 10 Zip Codes with the Highest Percentage of Population Employed in Food Preparation & Serving in Birmingham, AL are:
What zip code has the Highest Percentage of Population Employed in Food Preparation & Serving in Birmingham, AL?
35254 has the Highest Percentage of Population Employed in Food Preparation & Serving in Birmingham, AL with 25.3%.
What is the Percentage of Population Employed in Food Preparation & Serving in Birmingham, AL?
Percentage of Population Employed in Food Preparation & Serving in Birmingham is 6.3%.
What is the Percentage of Population Employed in Food Preparation & Serving in Alabama?
Percentage of Population Employed in Food Preparation & Serving in Alabama is 5.2%.
What is the Percentage of Population Employed in Food Preparation & Serving in the United States?
Percentage of Population Employed in Food Preparation & Serving in the United States is 5.3%.