Zip Codes with the Highest Percentage of Population Employed in Food Preparation & Serving in Mobile, AL
RELATED REPORTS & OPTIONS
Food Preparation & Serving
Mobile
Compare Zip Codes
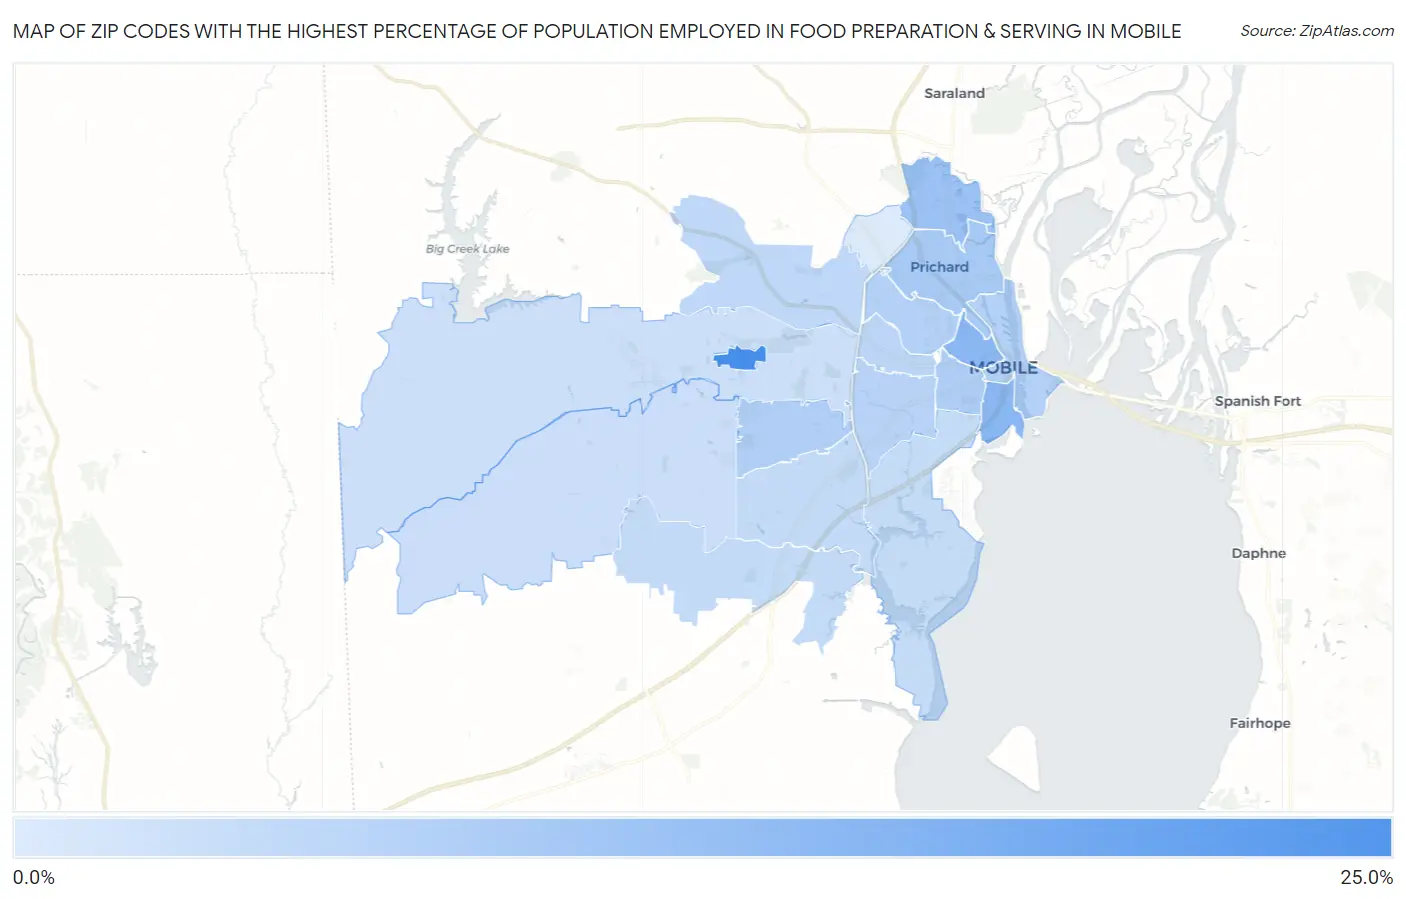
Map of Zip Codes with the Highest Percentage of Population Employed in Food Preparation & Serving in Mobile
1.9%
23.4%
Zip Codes with the Highest Percentage of Population Employed in Food Preparation & Serving in Mobile, AL
| Zip Code | % Employed | vs State | vs National | |
| 1. | 36688 | 23.4% | 5.2%(+18.2)#6 | 5.3%(+18.1)#371 |
| 2. | 36603 | 13.2% | 5.2%(+8.04)#26 | 5.3%(+7.96)#1,331 |
| 3. | 36611 | 10.8% | 5.2%(+5.62)#38 | 5.3%(+5.54)#2,147 |
| 4. | 36610 | 9.0% | 5.2%(+3.75)#72 | 5.3%(+3.67)#3,573 |
| 5. | 36604 | 8.2% | 5.2%(+2.99)#89 | 5.3%(+2.90)#4,457 |
| 6. | 36609 | 7.6% | 5.2%(+2.41)#108 | 5.3%(+2.32)#5,363 |
| 7. | 36617 | 7.5% | 5.2%(+2.27)#114 | 5.3%(+2.19)#5,603 |
| 8. | 36602 | 7.3% | 5.2%(+2.12)#119 | 5.3%(+2.04)#5,884 |
| 9. | 36606 | 6.7% | 5.2%(+1.50)#145 | 5.3%(+1.42)#7,335 |
| 10. | 36607 | 6.2% | 5.2%(+1.01)#170 | 5.3%(+0.923)#8,702 |
| 11. | 36618 | 5.9% | 5.2%(+0.699)#185 | 5.3%(+0.613)#9,689 |
| 12. | 36619 | 5.2% | 5.2%(-0.014)#236 | 5.3%(-0.100)#12,213 |
| 13. | 36693 | 5.1% | 5.2%(-0.052)#240 | 5.3%(-0.138)#12,371 |
| 14. | 36605 | 4.9% | 5.2%(-0.297)#258 | 5.3%(-0.383)#13,330 |
| 15. | 36695 | 4.3% | 5.2%(-0.869)#297 | 5.3%(-0.955)#15,737 |
| 16. | 36608 | 4.1% | 5.2%(-1.08)#310 | 5.3%(-1.17)#16,637 |
| 17. | 36612 | 1.9% | 5.2%(-3.32)#461 | 5.3%(-3.40)#25,047 |
1
Common Questions
What are the Top 10 Zip Codes with the Highest Percentage of Population Employed in Food Preparation & Serving in Mobile, AL?
Top 10 Zip Codes with the Highest Percentage of Population Employed in Food Preparation & Serving in Mobile, AL are:
What zip code has the Highest Percentage of Population Employed in Food Preparation & Serving in Mobile, AL?
36688 has the Highest Percentage of Population Employed in Food Preparation & Serving in Mobile, AL with 23.4%.
What is the Percentage of Population Employed in Food Preparation & Serving in Mobile, AL?
Percentage of Population Employed in Food Preparation & Serving in Mobile is 6.4%.
What is the Percentage of Population Employed in Food Preparation & Serving in Alabama?
Percentage of Population Employed in Food Preparation & Serving in Alabama is 5.2%.
What is the Percentage of Population Employed in Food Preparation & Serving in the United States?
Percentage of Population Employed in Food Preparation & Serving in the United States is 5.3%.