Zip Codes with the Highest Percentage of Population Employed in Food Preparation & Serving in Phenix City, AL
RELATED REPORTS & OPTIONS
Food Preparation & Serving
Phenix City
Compare Zip Codes
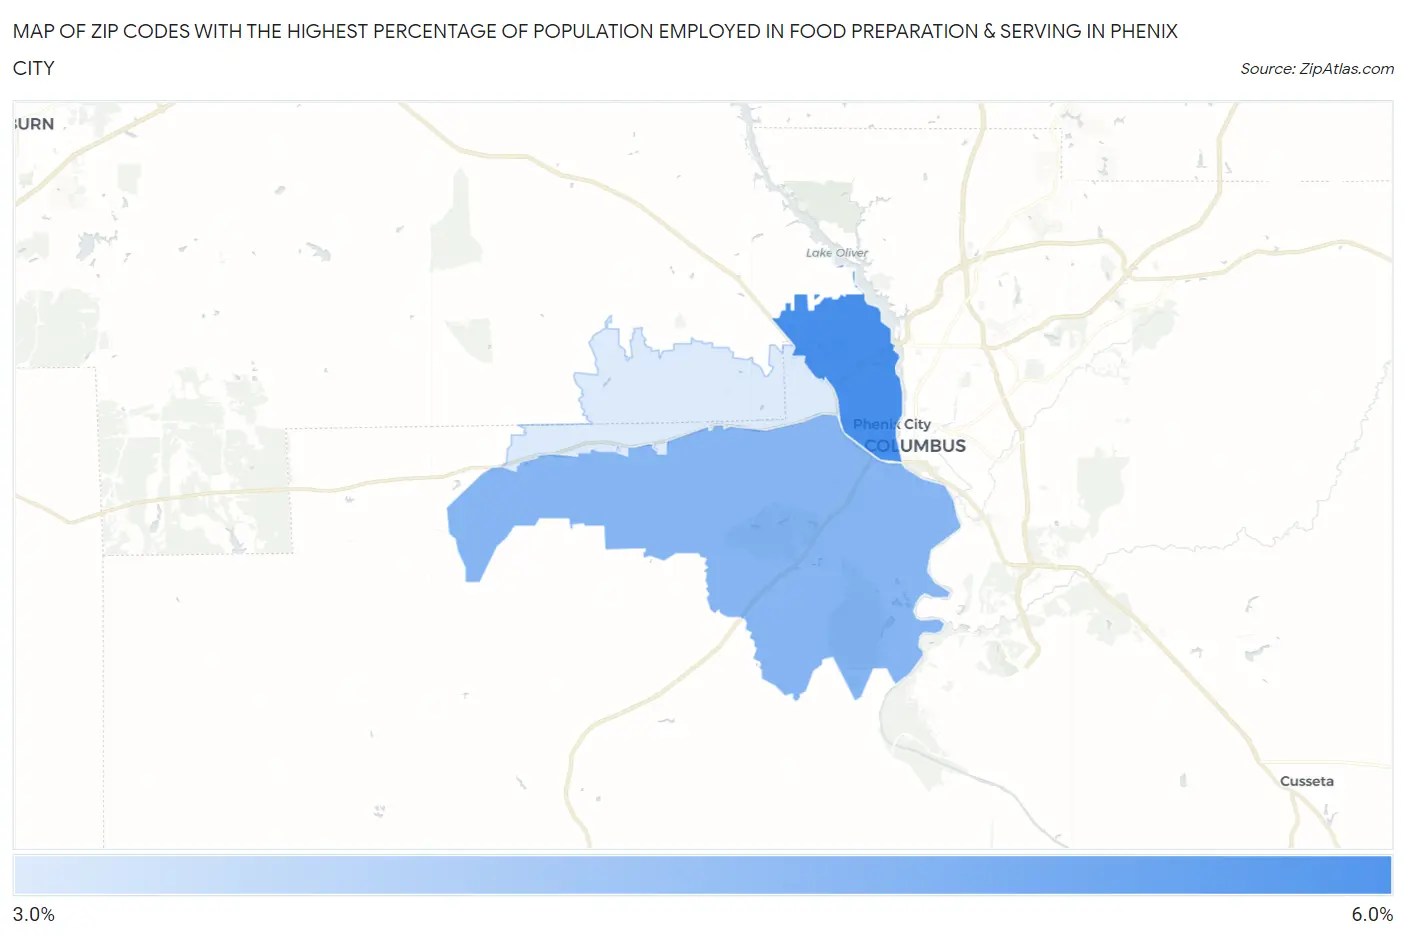
Map of Zip Codes with the Highest Percentage of Population Employed in Food Preparation & Serving in Phenix City
3.5%
5.3%
Zip Codes with the Highest Percentage of Population Employed in Food Preparation & Serving in Phenix City, AL
| Zip Code | % Employed | vs State | vs National | |
| 1. | 36867 | 5.3% | 5.2%(+0.070)#234 | 5.3%(-0.016)#11,868 |
| 2. | 36869 | 4.6% | 5.2%(-0.649)#281 | 5.3%(-0.735)#14,820 |
| 3. | 36870 | 3.5% | 5.2%(-1.67)#353 | 5.3%(-1.76)#19,090 |
1
Common Questions
What are the Top Zip Codes with the Highest Percentage of Population Employed in Food Preparation & Serving in Phenix City, AL?
Top Zip Codes with the Highest Percentage of Population Employed in Food Preparation & Serving in Phenix City, AL are:
What zip code has the Highest Percentage of Population Employed in Food Preparation & Serving in Phenix City, AL?
36867 has the Highest Percentage of Population Employed in Food Preparation & Serving in Phenix City, AL with 5.3%.
What is the Percentage of Population Employed in Food Preparation & Serving in Phenix City, AL?
Percentage of Population Employed in Food Preparation & Serving in Phenix City is 4.4%.
What is the Percentage of Population Employed in Food Preparation & Serving in Alabama?
Percentage of Population Employed in Food Preparation & Serving in Alabama is 5.2%.
What is the Percentage of Population Employed in Food Preparation & Serving in the United States?
Percentage of Population Employed in Food Preparation & Serving in the United States is 5.3%.