Zip Codes with the Highest Percentage of Population Employed in Food Preparation & Serving in Auburn, AL
RELATED REPORTS & OPTIONS
Food Preparation & Serving
Auburn
Compare Zip Codes
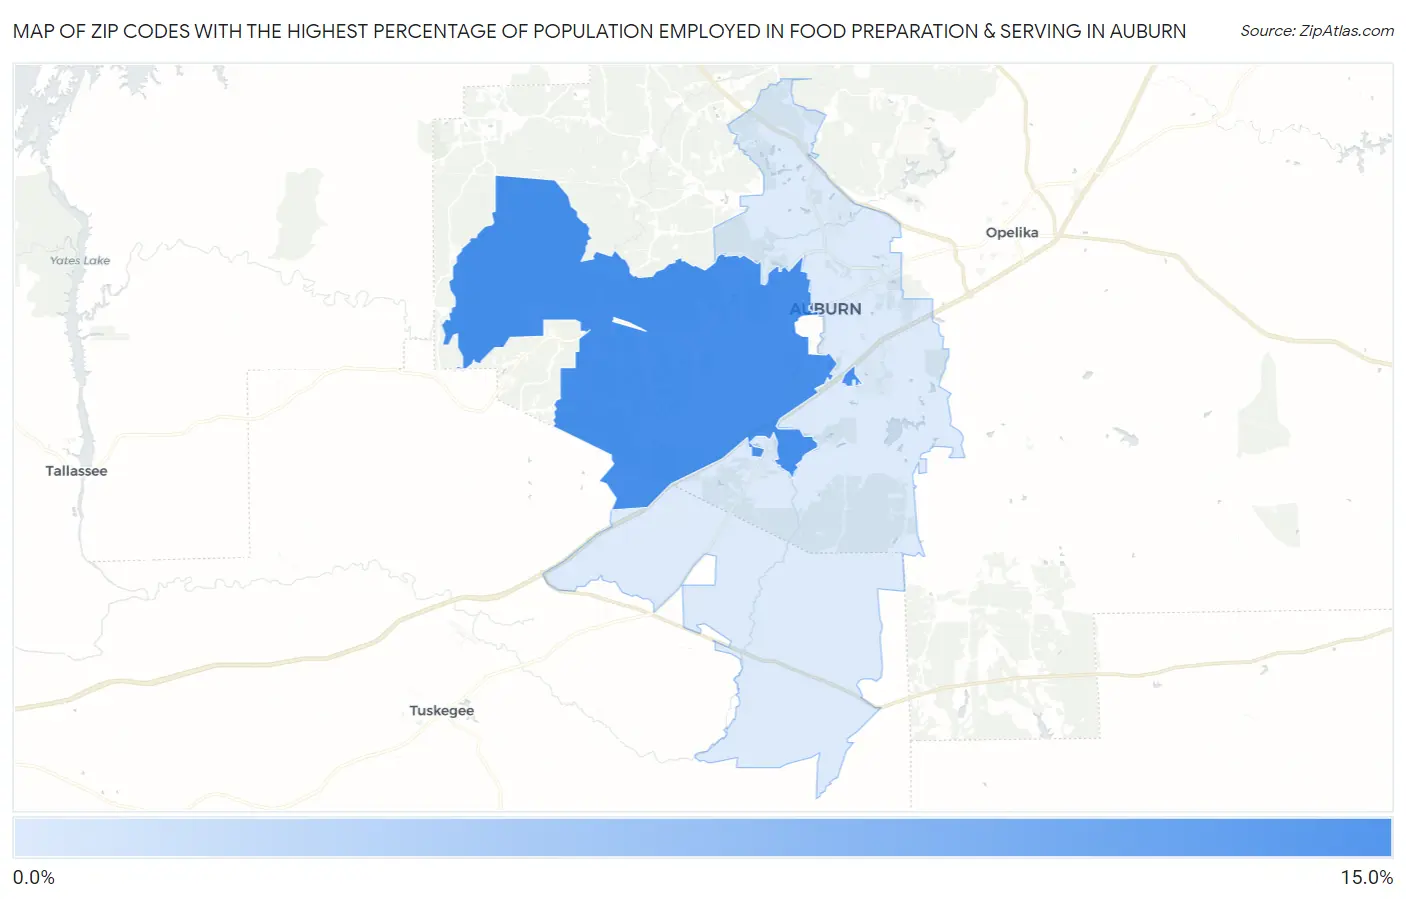
Map of Zip Codes with the Highest Percentage of Population Employed in Food Preparation & Serving in Auburn
4.7%
11.1%
Zip Codes with the Highest Percentage of Population Employed in Food Preparation & Serving in Auburn, AL
| Zip Code | % Employed | vs State | vs National | |
| 1. | 36832 | 11.1% | 5.2%(+5.90)#37 | 5.3%(+5.82)#2,013 |
| 2. | 36830 | 4.7% | 5.2%(-0.460)#268 | 5.3%(-0.546)#13,995 |
1
Common Questions
What are the Top Zip Codes with the Highest Percentage of Population Employed in Food Preparation & Serving in Auburn, AL?
Top Zip Codes with the Highest Percentage of Population Employed in Food Preparation & Serving in Auburn, AL are:
What zip code has the Highest Percentage of Population Employed in Food Preparation & Serving in Auburn, AL?
36832 has the Highest Percentage of Population Employed in Food Preparation & Serving in Auburn, AL with 11.1%.
What is the Percentage of Population Employed in Food Preparation & Serving in Auburn, AL?
Percentage of Population Employed in Food Preparation & Serving in Auburn is 7.4%.
What is the Percentage of Population Employed in Food Preparation & Serving in Alabama?
Percentage of Population Employed in Food Preparation & Serving in Alabama is 5.2%.
What is the Percentage of Population Employed in Food Preparation & Serving in the United States?
Percentage of Population Employed in Food Preparation & Serving in the United States is 5.3%.