Zip Codes with the Highest Percentage of Population Employed in Business & Financial in Birmingham, AL
RELATED REPORTS & OPTIONS
Business & Financial
Birmingham
Compare Zip Codes
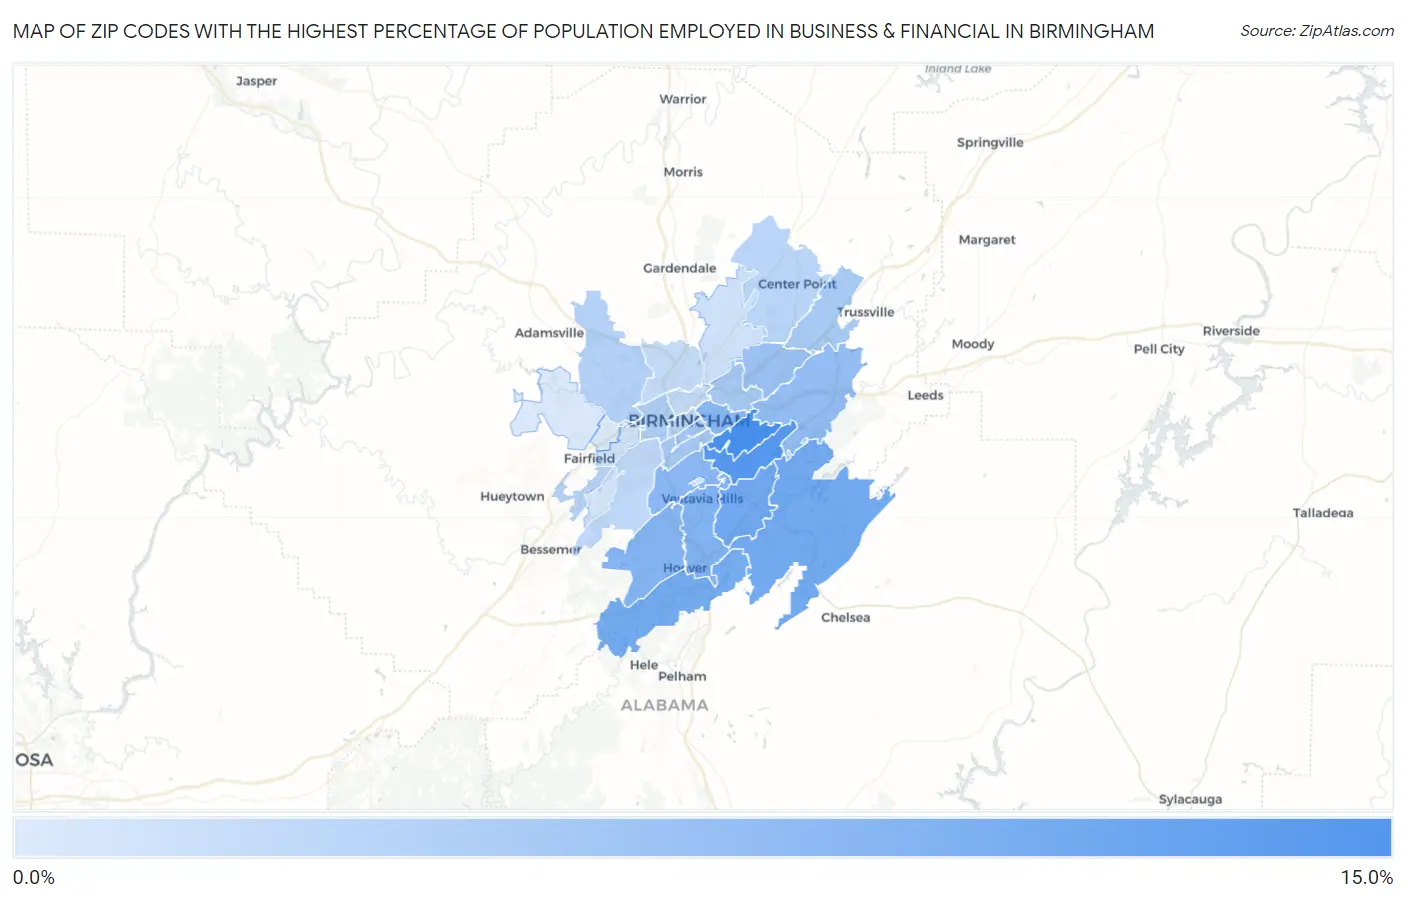
Map of Zip Codes with the Highest Percentage of Population Employed in Business & Financial in Birmingham
0.66%
13.9%
Zip Codes with the Highest Percentage of Population Employed in Business & Financial in Birmingham, AL
| Zip Code | % Employed | vs State | vs National | |
| 1. | 35213 | 13.9% | 4.5%(+9.43)#11 | 5.8%(+8.17)#750 |
| 2. | 35223 | 12.6% | 4.5%(+8.10)#12 | 5.8%(+6.84)#1,027 |
| 3. | 35243 | 10.1% | 4.5%(+5.56)#19 | 5.8%(+4.30)#2,152 |
| 4. | 35242 | 9.9% | 4.5%(+5.41)#21 | 5.8%(+4.15)#2,266 |
| 5. | 35244 | 9.6% | 4.5%(+5.11)#24 | 5.8%(+3.85)#2,526 |
| 6. | 35216 | 8.7% | 4.5%(+4.21)#31 | 5.8%(+2.95)#3,376 |
| 7. | 35226 | 8.3% | 4.5%(+3.76)#33 | 5.8%(+2.50)#3,893 |
| 8. | 35222 | 8.1% | 4.5%(+3.57)#36 | 5.8%(+2.31)#4,154 |
| 9. | 35209 | 7.8% | 4.5%(+3.32)#41 | 5.8%(+2.06)#4,493 |
| 10. | 35210 | 7.1% | 4.5%(+2.56)#62 | 5.8%(+1.30)#5,715 |
| 11. | 35206 | 6.2% | 4.5%(+1.71)#82 | 5.8%(+0.447)#7,356 |
| 12. | 35233 | 5.8% | 4.5%(+1.33)#95 | 5.8%(+0.073)#8,221 |
| 13. | 35205 | 5.5% | 4.5%(+0.960)#113 | 5.8%(-0.299)#9,129 |
| 14. | 35212 | 5.2% | 4.5%(+0.700)#131 | 5.8%(-0.559)#9,853 |
| 15. | 35235 | 5.1% | 4.5%(+0.575)#136 | 5.8%(-0.684)#10,248 |
| 16. | 35204 | 4.5% | 4.5%(+0.014)#171 | 5.8%(-1.24)#12,019 |
| 17. | 35214 | 4.1% | 4.5%(-0.392)#196 | 5.8%(-1.65)#13,455 |
| 18. | 35228 | 3.8% | 4.5%(-0.675)#211 | 5.8%(-1.93)#14,486 |
| 19. | 35203 | 3.7% | 4.5%(-0.839)#223 | 5.8%(-2.10)#15,164 |
| 20. | 35215 | 3.7% | 4.5%(-0.844)#225 | 5.8%(-2.10)#15,188 |
| 21. | 35211 | 3.1% | 4.5%(-1.41)#274 | 5.8%(-2.67)#17,446 |
| 22. | 35207 | 2.8% | 4.5%(-1.69)#304 | 5.8%(-2.95)#18,595 |
| 23. | 35234 | 2.8% | 4.5%(-1.71)#307 | 5.8%(-2.97)#18,650 |
| 24. | 35254 | 2.7% | 4.5%(-1.78)#315 | 5.8%(-3.04)#18,988 |
| 25. | 35217 | 1.8% | 4.5%(-2.67)#388 | 5.8%(-3.93)#22,418 |
| 26. | 35229 | 1.7% | 4.5%(-2.84)#404 | 5.8%(-4.10)#22,987 |
| 27. | 35208 | 1.6% | 4.5%(-2.86)#406 | 5.8%(-4.12)#23,050 |
| 28. | 35221 | 1.4% | 4.5%(-3.11)#432 | 5.8%(-4.37)#23,917 |
| 29. | 35224 | 0.82% | 4.5%(-3.68)#476 | 5.8%(-4.94)#25,492 |
| 30. | 35218 | 0.66% | 4.5%(-3.84)#482 | 5.8%(-5.10)#25,833 |
1
Common Questions
What are the Top 10 Zip Codes with the Highest Percentage of Population Employed in Business & Financial in Birmingham, AL?
Top 10 Zip Codes with the Highest Percentage of Population Employed in Business & Financial in Birmingham, AL are:
What zip code has the Highest Percentage of Population Employed in Business & Financial in Birmingham, AL?
35213 has the Highest Percentage of Population Employed in Business & Financial in Birmingham, AL with 13.9%.
What is the Percentage of Population Employed in Business & Financial in Birmingham, AL?
Percentage of Population Employed in Business & Financial in Birmingham is 5.3%.
What is the Percentage of Population Employed in Business & Financial in Alabama?
Percentage of Population Employed in Business & Financial in Alabama is 4.5%.
What is the Percentage of Population Employed in Business & Financial in the United States?
Percentage of Population Employed in Business & Financial in the United States is 5.8%.