Zip Codes with the Highest Percentage of Population Employed in Food Preparation & Serving in Andalusia, AL
RELATED REPORTS & OPTIONS
Food Preparation & Serving
Andalusia
Compare Zip Codes
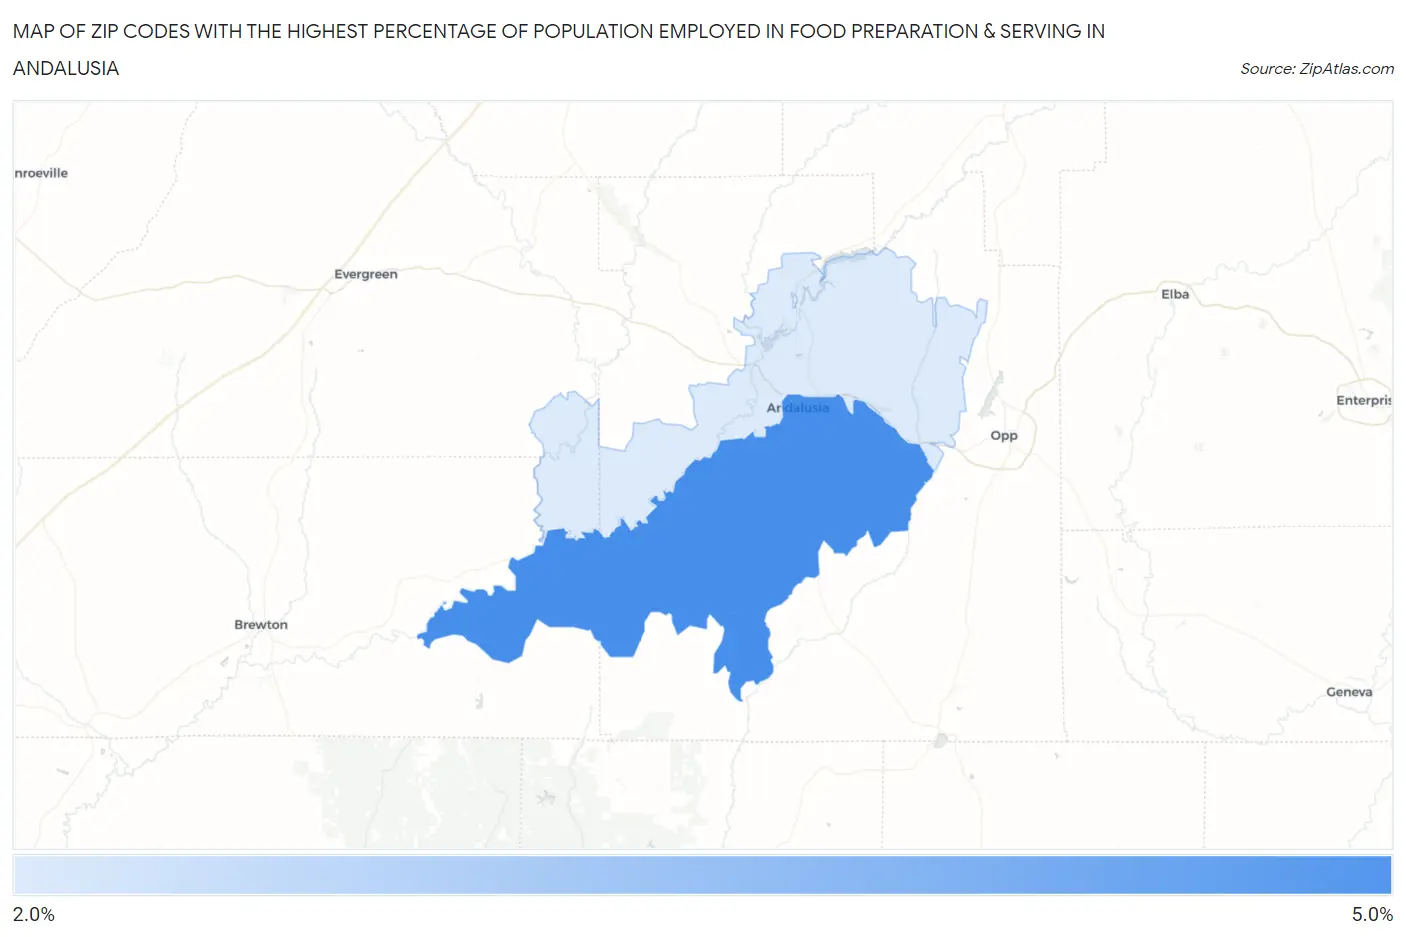
Map of Zip Codes with the Highest Percentage of Population Employed in Food Preparation & Serving in Andalusia
2.2%
4.6%
Zip Codes with the Highest Percentage of Population Employed in Food Preparation & Serving in Andalusia, AL
| Zip Code | % Employed | vs State | vs National | |
| 1. | 36420 | 4.6% | 5.2%(-0.606)#276 | 5.3%(-0.691)#14,623 |
| 2. | 36421 | 2.2% | 5.2%(-3.01)#439 | 5.3%(-3.09)#24,124 |
1
Common Questions
What are the Top Zip Codes with the Highest Percentage of Population Employed in Food Preparation & Serving in Andalusia, AL?
Top Zip Codes with the Highest Percentage of Population Employed in Food Preparation & Serving in Andalusia, AL are:
What zip code has the Highest Percentage of Population Employed in Food Preparation & Serving in Andalusia, AL?
36420 has the Highest Percentage of Population Employed in Food Preparation & Serving in Andalusia, AL with 4.6%.
What is the Percentage of Population Employed in Food Preparation & Serving in Andalusia, AL?
Percentage of Population Employed in Food Preparation & Serving in Andalusia is 6.5%.
What is the Percentage of Population Employed in Food Preparation & Serving in Alabama?
Percentage of Population Employed in Food Preparation & Serving in Alabama is 5.2%.
What is the Percentage of Population Employed in Food Preparation & Serving in the United States?
Percentage of Population Employed in Food Preparation & Serving in the United States is 5.3%.