Zip Codes with the Highest Percentage of Households Without a Vehicle in Birmingham, AL
RELATED REPORTS & OPTIONS
Households without a Cars
Birmingham
Compare Zip Codes
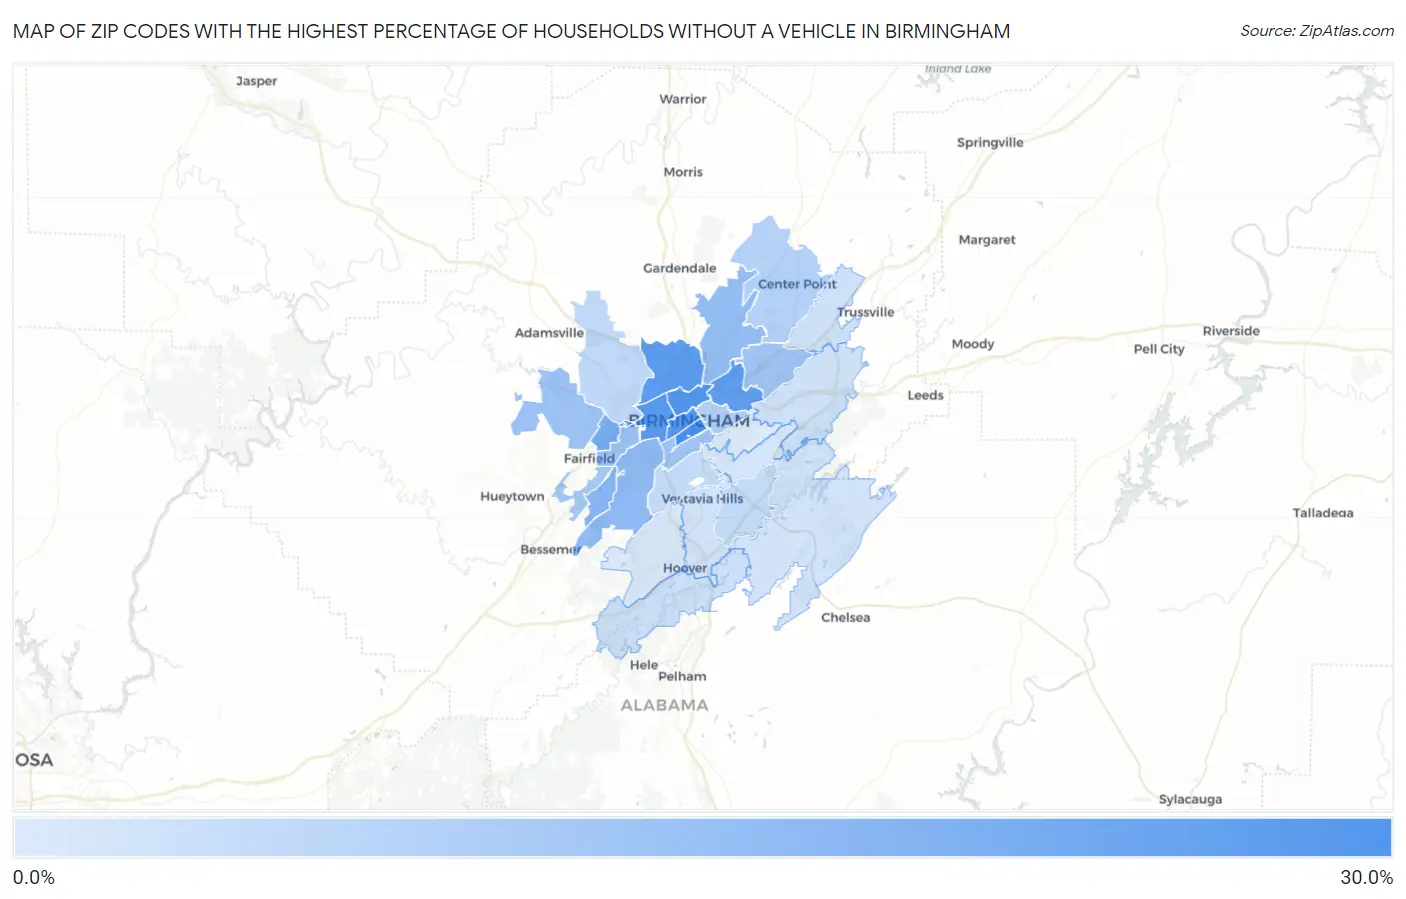
Map of Zip Codes with the Highest Percentage of Households Without a Vehicle in Birmingham
0.90%
26.7%
Zip Codes with the Highest Percentage of Households Without a Vehicle in Birmingham, AL
| Zip Code | Housholds Without a Car | vs State | vs National | |
| 1. | 35233 | 26.7% | 5.6%(+21.1)#10 | 8.3%(+18.4)#964 |
| 2. | 35234 | 24.3% | 5.6%(+18.7)#12 | 8.3%(+16.0)#1,113 |
| 3. | 35203 | 24.0% | 5.6%(+18.4)#13 | 8.3%(+15.7)#1,140 |
| 4. | 35204 | 23.7% | 5.6%(+18.1)#14 | 8.3%(+15.4)#1,163 |
| 5. | 35207 | 22.8% | 5.6%(+17.2)#16 | 8.3%(+14.5)#1,234 |
| 6. | 35212 | 21.9% | 5.6%(+16.3)#18 | 8.3%(+13.6)#1,307 |
| 7. | 35218 | 17.8% | 5.6%(+12.2)#34 | 8.3%(+9.50)#1,822 |
| 8. | 35221 | 14.9% | 5.6%(+9.30)#50 | 8.3%(+6.60)#2,424 |
| 9. | 35211 | 13.5% | 5.6%(+7.90)#65 | 8.3%(+5.20)#2,878 |
| 10. | 35217 | 13.0% | 5.6%(+7.40)#69 | 8.3%(+4.70)#3,097 |
| 11. | 35224 | 11.4% | 5.6%(+5.80)#85 | 8.3%(+3.10)#3,905 |
| 12. | 35208 | 11.3% | 5.6%(+5.70)#86 | 8.3%(+3.00)#3,952 |
| 13. | 35205 | 10.6% | 5.6%(+5.00)#93 | 8.3%(+2.30)#4,397 |
| 14. | 35206 | 10.6% | 5.6%(+5.00)#94 | 8.3%(+2.30)#4,399 |
| 15. | 35228 | 9.4% | 5.6%(+3.80)#120 | 8.3%(+1.10)#5,366 |
| 16. | 35222 | 7.7% | 5.6%(+2.10)#153 | 8.3%(-0.600)#7,424 |
| 17. | 35215 | 7.4% | 5.6%(+1.80)#162 | 8.3%(-0.900)#7,844 |
| 18. | 35214 | 5.7% | 5.6%(+0.100)#216 | 8.3%(-2.60)#11,164 |
| 19. | 35243 | 5.0% | 5.6%(-0.600)#254 | 8.3%(-3.30)#12,893 |
| 20. | 35209 | 4.7% | 5.6%(-0.900)#274 | 8.3%(-3.60)#13,655 |
| 21. | 35244 | 3.4% | 5.6%(-2.20)#353 | 8.3%(-4.90)#17,623 |
| 22. | 35210 | 3.2% | 5.6%(-2.40)#368 | 8.3%(-5.10)#18,406 |
| 23. | 35235 | 3.0% | 5.6%(-2.60)#390 | 8.3%(-5.30)#19,100 |
| 24. | 35216 | 2.8% | 5.6%(-2.80)#410 | 8.3%(-5.50)#19,740 |
| 25. | 35242 | 2.6% | 5.6%(-3.00)#425 | 8.3%(-5.70)#20,386 |
| 26. | 35223 | 2.2% | 5.6%(-3.40)#452 | 8.3%(-6.10)#21,792 |
| 27. | 35226 | 1.1% | 5.6%(-4.50)#516 | 8.3%(-7.20)#25,335 |
| 28. | 35213 | 0.90% | 5.6%(-4.70)#525 | 8.3%(-7.40)#25,875 |
1
Common Questions
What are the Top 10 Zip Codes with the Highest Percentage of Households Without a Vehicle in Birmingham, AL?
Top 10 Zip Codes with the Highest Percentage of Households Without a Vehicle in Birmingham, AL are:
What zip code has the Highest Percentage of Households Without a Vehicle in Birmingham, AL?
35233 has the Highest Percentage of Households Without a Vehicle in Birmingham, AL with 26.7%.
What is the Percentage of Households Without a Vehicle in Birmingham, AL?
Percentage of Households Without a Vehicle in Birmingham is 12.5%.
What is the Percentage of Households Without a Vehicle in Alabama?
Percentage of Households Without a Vehicle in Alabama is 5.6%.
What is the Percentage of Households Without a Vehicle in the United States?
Percentage of Households Without a Vehicle in the United States is 8.3%.