Zip Codes with the Highest Percentage of Population Employed in Food Preparation & Serving in Sylacauga, AL
RELATED REPORTS & OPTIONS
Food Preparation & Serving
Sylacauga
Compare Zip Codes
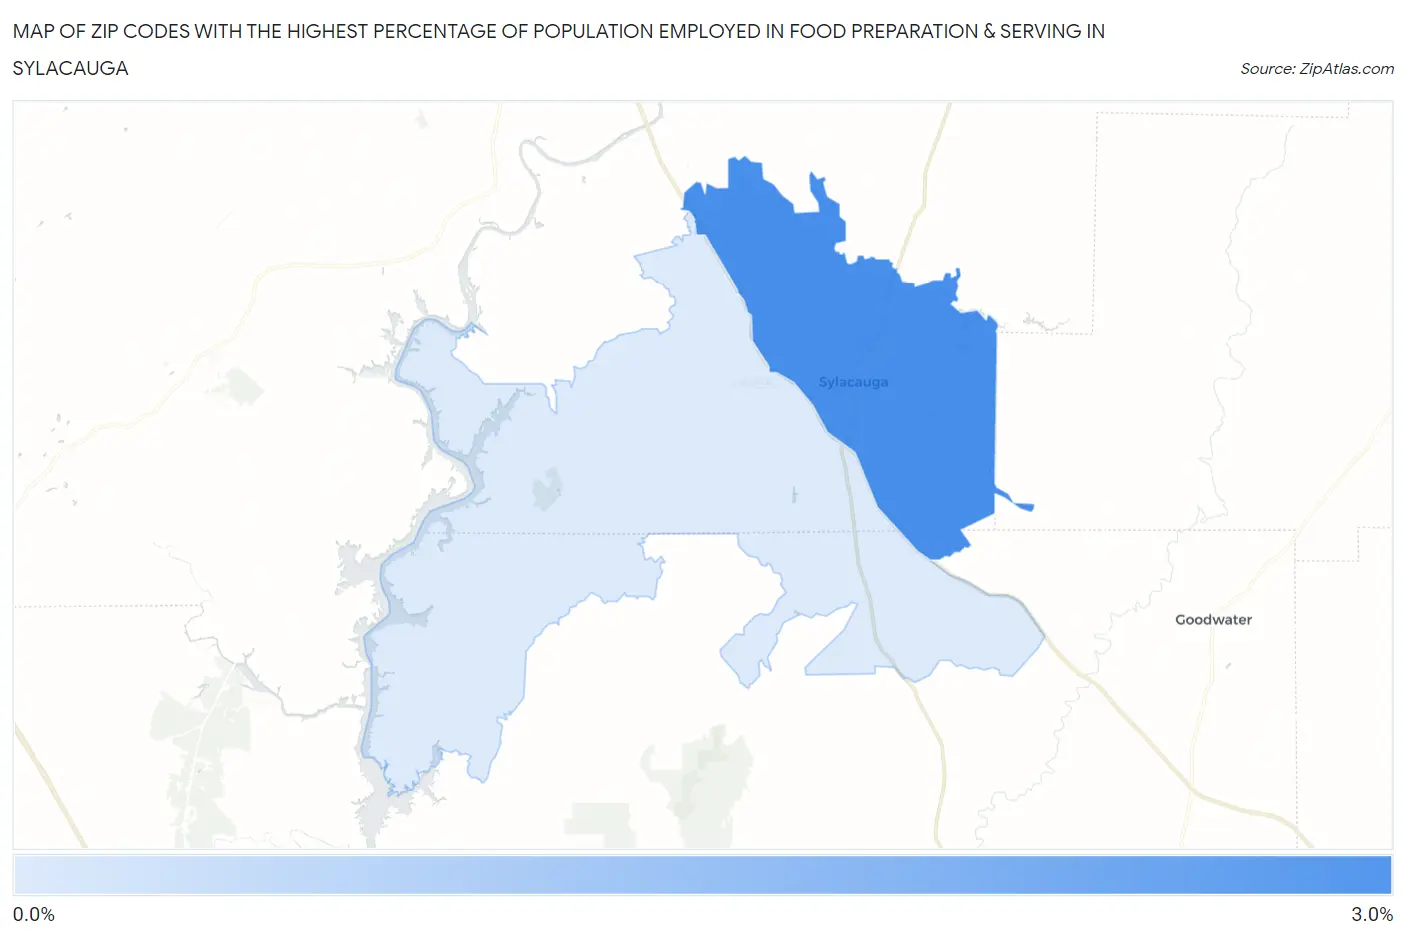
Map of Zip Codes with the Highest Percentage of Population Employed in Food Preparation & Serving in Sylacauga
0.21%
2.8%
Zip Codes with the Highest Percentage of Population Employed in Food Preparation & Serving in Sylacauga, AL
| Zip Code | % Employed | vs State | vs National | |
| 1. | 35150 | 2.8% | 5.2%(-2.45)#410 | 5.3%(-2.53)#22,241 |
| 2. | 35151 | 0.21% | 5.2%(-4.99)#536 | 5.3%(-5.08)#27,895 |
1
Common Questions
What are the Top Zip Codes with the Highest Percentage of Population Employed in Food Preparation & Serving in Sylacauga, AL?
Top Zip Codes with the Highest Percentage of Population Employed in Food Preparation & Serving in Sylacauga, AL are:
What zip code has the Highest Percentage of Population Employed in Food Preparation & Serving in Sylacauga, AL?
35150 has the Highest Percentage of Population Employed in Food Preparation & Serving in Sylacauga, AL with 2.8%.
What is the Percentage of Population Employed in Food Preparation & Serving in Sylacauga, AL?
Percentage of Population Employed in Food Preparation & Serving in Sylacauga is 3.0%.
What is the Percentage of Population Employed in Food Preparation & Serving in Alabama?
Percentage of Population Employed in Food Preparation & Serving in Alabama is 5.2%.
What is the Percentage of Population Employed in Food Preparation & Serving in the United States?
Percentage of Population Employed in Food Preparation & Serving in the United States is 5.3%.